HIAP TECK VENTURE BHD (HIAPTEK)
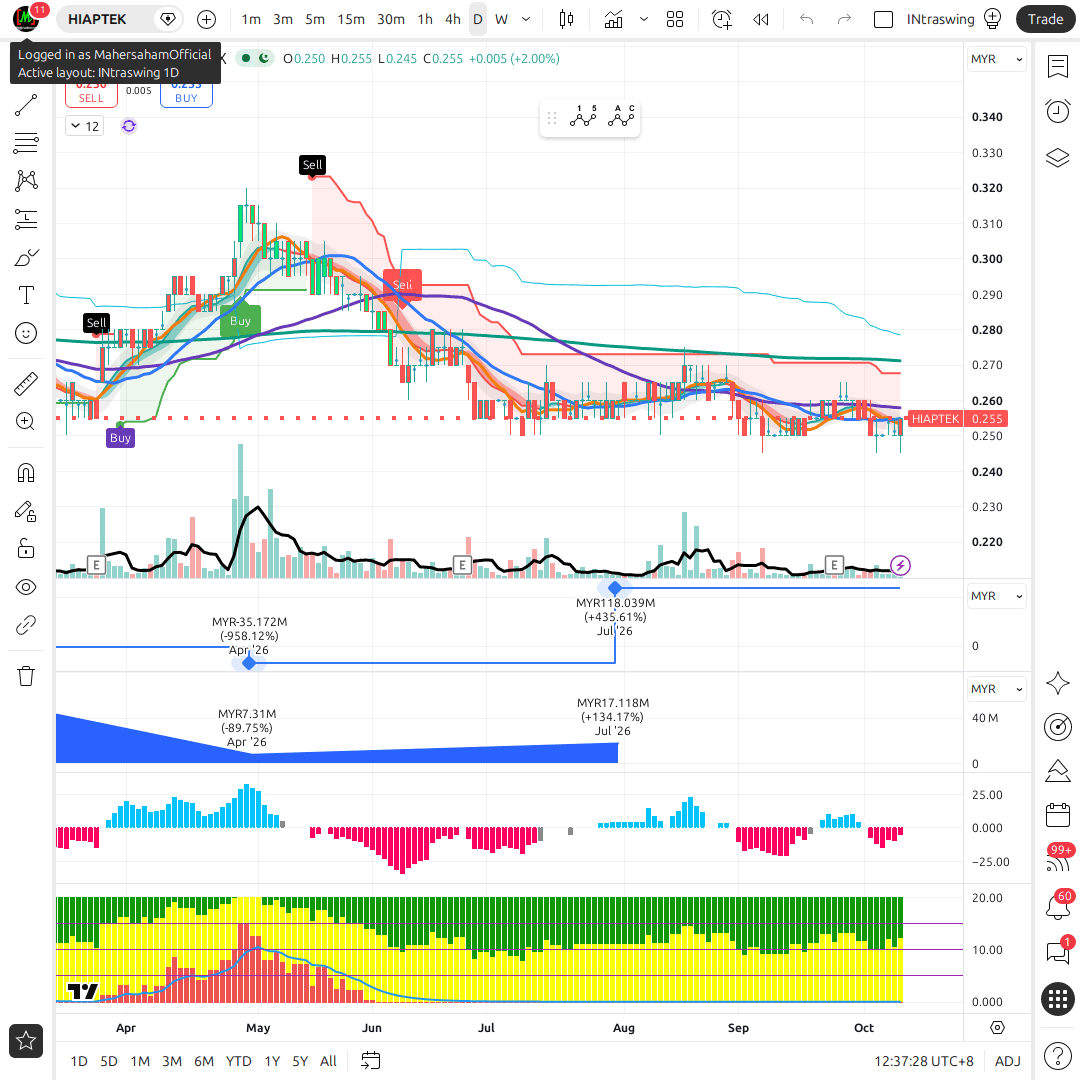
HIAPTEK Chart
1D • MYX
9 Oct, 04:37 am
173.0 KB
Company Profile: HIAP TECK VENTURE BHD
Company Profile: HIAP TECK VENTURE BHD (HIAPTEK)
Hiap Teck Venture Bhd (Bursa Code: 5072) is a diversified metals and steel group with decades of operating history in Malaysia. Listed on Bursa Malaysia under the Metals sector, the company operates across five complementary business segments that together form an integrated value chain in the steel industry.
Five Core Business Segments
- 1. Trading - The largest revenue contributor. Covers import/export of steel products, hardware, and building materials. This segment forms the commercial backbone of Hiap Teck, generating consistent high-volume revenue.
- 2. Manufacturing - Production of steel pipes, hollow sections, and scaffolding products. Hiap Teck is recognized as one of the largest domestic steel pipe manufacturers in Malaysia.
- 3. Property & Investment - Commercial property leasing and investment holding, providing stable recurring passive income.
- 4. Transportation - Freight and logistics services supporting the group's trading and manufacturing operations.
- 5. Mining & Exploration - Mining activities forming part of the group's diversification portfolio.
The Key Strategic Asset: ESSB (Eastern Steel Sdn Bhd)
The single most important strategic development for Hiap Teck today is its joint venture stake in Eastern Steel Sdn Bhd (ESSB). ESSB operates a 1,450mm hot-rolled coil (HRC) production line - one of the first HRC facilities of its kind in East Malaysia.
Critical ESSB milestones:
- December 2024: HRC plant officially commenced operations
- January 2026: Achieved optimum utilisation - ahead of original guidance (which targeted end-FY2026)
- ESSB contribution Q2 FY2026: RM70.6 million vs RM25.3 million in the prior year (+179% YoY)
- ESSB contribution H1 FY2026: RM106.4 million (reported); RM67.2 million (core, excluding FX translation gains)
RM3 Billion Long-Term Expansion
Eastern Steel has announced long-term expansion plans valued at RM3 billion, with the ambition of developing into a fully integrated steel player of regional significance. This remains a long-term catalyst still in the planning and early execution phase, representing substantial optionality value for patient investors.
Key Company Metrics
| Item | Details |
|---|---|
| Company Name | Hiap Teck Venture Bhd |
| Bursa Code | 5072 (HIAPTEK) |
| Sector | Metals (Bursa Malaysia) |
| Financial Year End | 31 July |
| Current Price | RM0.26 |
| Shares Outstanding | ~1,773 million |
| Market Capitalisation | ~RM461 million |
| Shariah Status | To be verified |
Exclusive Gold Members Content
Get in-depth analysis, target prices, and investment recommendations with Gold Members subscription.
How to Get Gold AccessCANSLIM Analysis
Exclusive Gold Members Content
Get in-depth analysis, target prices, and investment recommendations with Gold Members subscription.
How to Get Gold AccessFinancial Analysis
Financial Analysis: HIAPTEK FY2026
FY2026 (year ended 31 July 2026) net profit was RM137.8 million, up 26.3% from RM109.1 million, while revenue was almost flat at RM1.43 billion. The real question for investors is how much of this repeats: core profit was RM125.8 million (+24.4%), equal to 106.1% of HLIB's forecast (a beat).
| Quarter | Revenue (RM m) | Net profit (RM m) | Margin | EPS (sen) | Core profit (RM m) |
|---|---|---|---|---|---|
| Q1 FY25 (Oct 24) | 401.7 | 34.7 | 8.6% | 1.99 | - |
| Q2 FY25 (Jan 25) | 348.3 | 20.4 | 5.9% | 1.17 | - |
| Q3 FY25 (Apr 25) | 344.8 | 34.3 | 9.9% | 1.97 | - |
| Q4 FY25 (Jul 25) | 342.7 | 19.7 | 5.7% | 1.13 | - |
| Q1 FY26 (Oct 25) | 384.2 | 43.5 | 11.3% | 2.50 | ~33.6 |
| Q2 FY26 (Jan 26) | 397.4 | 68.8 | 17.3% | 3.95 | ~28.3 |
| Q3 FY26 (Apr 26) | 399.9 | 5.4 | 1.3% | ~0.31 | ~24.5 |
| Q4 FY26 (Jul 26) | 246.6 | 20.1 | 8.2% | ~1.15 | 39.4 |
Notes: Q3 and Q4 EPS are computed as net profit divided by 1,747 million shares. Core profit for Q1 to Q3 is derived (approximate) from the percentage changes reported by HLIB; the first-half total of RM61.9 million is consistent with the RM125.8 million full-year figure.
Reported versus core earnings
| Period | Reported (RM m) | Core (RM m) | Difference |
|---|---|---|---|
| H1 FY26 (Oct 25 - Jan 26) | 112.3 | ~61.9 | +50.4 (FX translation gains) |
| Q3 FY26 | 5.38 | ~24.5 | -19.1 |
| Q4 FY26 | 20.15 | 39.4 | -19.2 |
| Full FY26 | 137.8 | 125.8 | +12.0 |
The first half was helped by roughly RM50 million of non-core gains, and the second half gave back most of it (about RM38 million). Put simply: reported earnings imply a PE of about 3.3 times and core earnings about 3.6 times at RM0.26. We use core earnings as the base.
Revenue trend: Q4 revenue was only RM246.6 million, down 38.3% from Q3. Management cited lower sales volumes and lower average steel selling prices in the quarter, offset by better manufacturing margins and smaller losses in the trading segment.
Exclusive Gold Members Content
Get in-depth analysis, target prices, and investment recommendations with Gold Members subscription.
How to Get Gold AccessDividends
HIAPTEK Dividends
The board proposed a first and final dividend of 0.7 sen per share for FY2026 (up from 0.5 sen for FY2025); entitlement and payment dates are to be announced later. At RM0.26, the dividend yield is about 2.7%.
| Financial year | DPS (sen) | EPS (sen) | Payout ratio |
|---|---|---|---|
| FY2019 | 0.5 | 1.89 | 26% |
| FY2020 | 0.3 | 0.32 | 94% |
| FY2021 | 1.0 | 11.77 | 8% |
| FY2022 | 1.0 | 9.00 | 11% |
| FY2023 | 0.5 | 1.78 | 28% |
| FY2024 | 0.5 | 6.11 | 8% |
| FY2025 | 0.5 | 6.26 | 8% |
| FY2026 | 0.7 | 7.91 | 9% |
HIAPTEK has paid a dividend every year since FY2018, but the amounts are small and fixed (0.3 to 1.0 sen). The payout ratio is mostly around 8% to 11% of EPS, except in low-profit years. This is not an income stock; it is better seen as a value stock with a small dividend bonus.
Exclusive Gold Members Content
Get in-depth analysis, target prices, and investment recommendations with Gold Members subscription.
How to Get Gold AccessValuation - HIAPTEK
Exclusive Gold Members Content
Get in-depth analysis, target prices, and investment recommendations with Gold Members subscription.
How to Get Gold AccessPeer Comparison - Bursa Metals Sector
Exclusive Gold Members Content
Get in-depth analysis, target prices, and investment recommendations with Gold Members subscription.
How to Get Gold AccessRed Flags - HIAPTEK Risks
Exclusive Gold Members Content
Get in-depth analysis, target prices, and investment recommendations with Gold Members subscription.
How to Get Gold AccessInvestment Scorecard - HIAPTEK
Exclusive Gold Members Content
Get in-depth analysis, target prices, and investment recommendations with Gold Members subscription.
How to Get Gold AccessCatalysts & Future Risks - HIAPTEK
Exclusive Gold Members Content
Get in-depth analysis, target prices, and investment recommendations with Gold Members subscription.
How to Get Gold AccessConclusion - HIAP TECK VENTURE BHD
Exclusive Gold Members Content
Get in-depth analysis, target prices, and investment recommendations with Gold Members subscription.
How to Get Gold AccessRelated Stocks
Other stocks in the Metals & Mining sector