CPE TECHNOLOGY BERHAD (CPETECH)
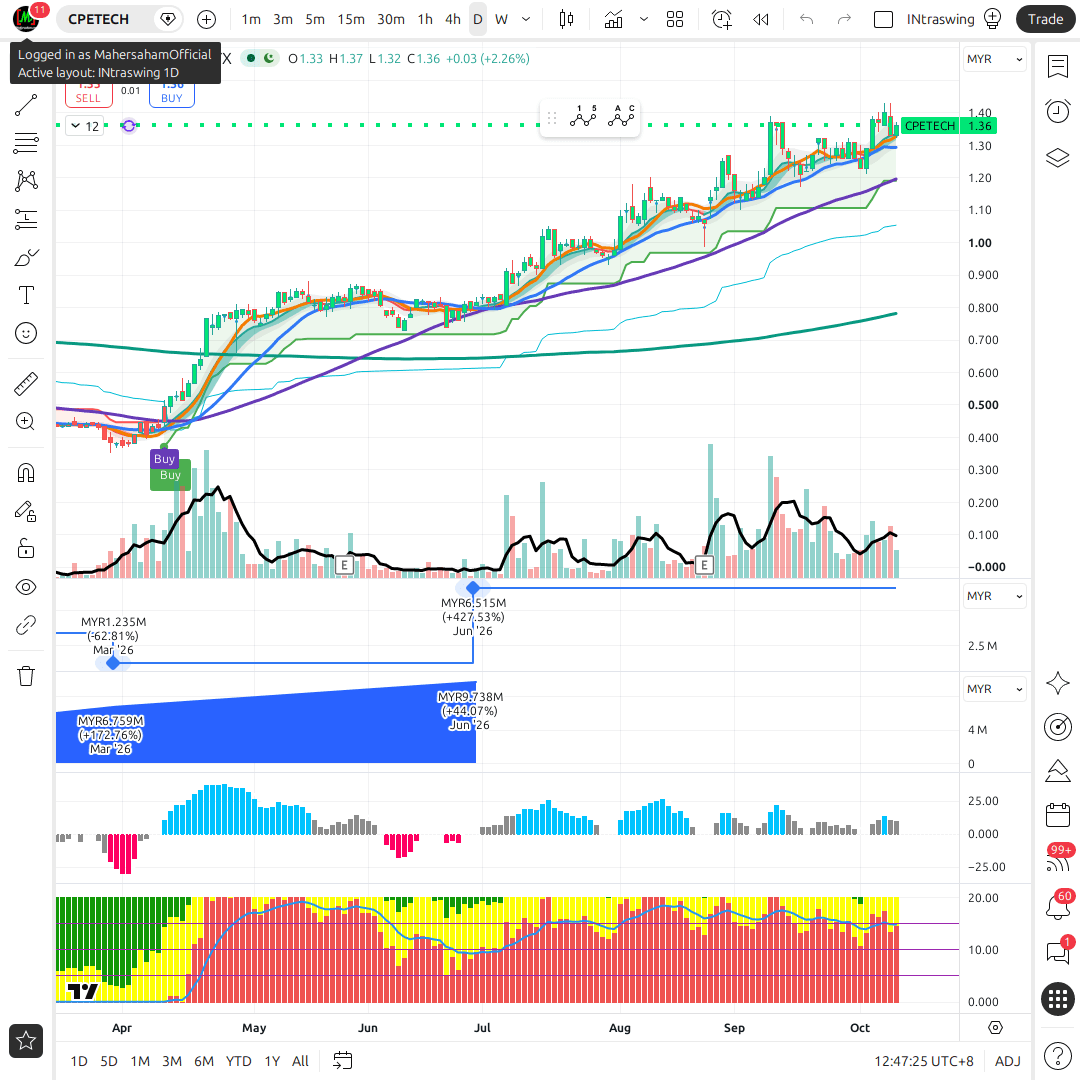
CPETECH Chart
1D • MYX
9 Oct, 04:47 am
173.8 KB
Company Profile — CPE TECHNOLOGY BERHAD
CPE Technology Berhad (5317) — An Integrated Gas System Supplier to Wafer Fabs
Read only the sector classification and CPE Technology looks like an ordinary CNC machining shop in Johor. That reading is badly wrong. CPETECH actually occupies a very narrow but very hard-to-enter niche: manufacturing high-precision components for Integrated Gas Systems (IGS) — the ultra-high-purity gas delivery systems that feed process gases into semiconductor wafer processing chambers.
IGS is a critical component in front-end wafer fab equipment: oxidation, photolithography and etching. A single contaminant particle or an internal surface that is not smooth enough can ruin a wafer worth tens of thousands of dollars. That is why equipment makers such as Tokyo Electron, Lam Research and Applied Materials impose «Copy Exact» standards — specifications that lock down every machining parameter, internal finish and contamination tolerance. Passing that qualification takes years. Once passed, customers do not switch suppliers easily.
That is CPETECH's real moat — not the CNC machines, but the customer qualification list.
Revenue by Industry Segment (FY2026, year ended 30 Jun 2026)
| Segment | FY26 Revenue (RM'000) | % of Revenue | YoY |
|---|---|---|---|
| Semiconductor | 77,625 | 66.2% | -9.0% |
| Sport Equipment | 17,484 | 14.9% | +18.5% |
| Life Science & Medical Devices | 11,248 | 9.6% | -40.4% |
| Aerospace | 4,907 | 4.2% | +4.4% |
| Sensor Equipment | 3,271 | 2.8% | +28.9% |
| Opto-mechanical | 1,177 | 1.0% | +117% |
| Automotive, Instrumentation, Security, Other | 1,516 | 1.3% | -38% |
| Total | 117,228 | 100% | -9.2% |
Note something most people miss: in Q4 FY26 alone, semiconductor jumped to 75.66% of revenue (RM27.20 million, up 23.3% YoY), while life science fell 54.8% YoY to RM1.65 million. In other words, CPETECH's recovery is narrow — driven almost entirely by one segment — and concentration risk is actually rising, not falling.
The Largest Expansion Programme in the Company's History
Between July and August 2026, CPETECH announced a series of capital commitments that change the company's profile:
- 17 July 2026 — 118 new CNC machines worth RM34.52 million (8 Citizen Cincom auto lathes, 45 Okuma CNC turning, 2 DMG, 3 Citizen Miyano, 60 Fanuc CNC milling). As at 30 Jun 2026, only 11 units had been received and commissioned; the remaining 107 are being delivered progressively through H2 calendar 2026.
- 5 August 2026 — a further 70 CNC machines worth RM21.02 million, for delivery in H1 calendar 2027.
- 5 August 2026 — purchase of a factory and 0.99 acres of land in Ulu Tiram, Johor from Flomatic Industries for RM10 million. Management describes the factory as «comparable in size to the Group's existing production facilities».
Total commitment: 188 CNC machines and RM65.5 million — against FY26 capital expenditure of just RM14.3 million. All of these were filed as non-related party transactions.
What Is Driving the Expansion
In the Q4 FY26 report, the Board stated that as at 30 Jun 2026 the Group's order book had approximately doubled versus six months earlier, driven by substantially higher order volumes from existing customers, inventory replenishment following the industry downturn, and improving market demand. The Group has also secured new customer projects expected to begin production ramp-up over the coming quarters.
Joint Venture with a Japanese Partner
In July 2026, CPETECH announced a proposed joint venture with Kanekita Co., Ltd (Japan) to build advanced cleaning and surface treatment capabilities for high-value precision components. This matters because it moves CPETECH up the value chain — from machining only, to machining and cleaning/surface treatment, a step that has until now been outsourced.
Size & Status
- Price (7 Sep 2026): RM1.19 | Market cap: RM798.9 million | Shares issued: 671,314,791
- 52-week range: RM0.35 – RM1.27 | 52-week change: +68.9%
- Financial year end: 30 June | Board: Bursa Malaysia Main Market
- Shariah status: Shariah-compliant
- Net cash: RM200.3 million (29.8 sen per share) — around 25% of market cap
Exclusive Gold Members Content
Get in-depth analysis, target prices, and investment recommendations with Gold Members subscription.
How to Get Gold AccessCANSLIM Analysis
Exclusive Gold Members Content
Get in-depth analysis, target prices, and investment recommendations with Gold Members subscription.
How to Get Gold AccessFinancial Analysis
CPETECH Financial Analysis — FY2026 & the Quarterly Trajectory
Look only at the full-year numbers and FY2026 looks like a bad year: revenue down 9.2% to RM117.23 million, net profit down 22.9% to RM18.19 million. Look only at the final quarter and it looks like a great year: record revenue of RM35.95 million, PBT up 116% YoY.
Both are true. That is why FY26 must be read as two very different halves.
The Real Story: H1 vs H2 FY2026
| Metric | H1 FY26 (Jul-Dec 2025) | H2 FY26 (Jan-Jun 2026) | Change |
|---|---|---|---|
| Revenue | RM50.59m | RM66.64m | +31.7% |
| Gross Profit | RM9.15m | RM18.99m | +107.5% |
| Gross Margin | 18.1% | 28.5% | +10.4 pts |
| Net Profit | RM5.15m | RM13.04m | +153.2% |
Why was H1 weak? Management explains it plainly in the Q4 report: Q4 revenue rose «mainly due to higher production volume following the progressive return of production capacity to mass production activities. As new product development activities undertaken in the earlier quarters moderated, the Group was able to allocate more resources to fulfil existing customer demand.»
Translated: in H1 FY26, CPETECH's machines were busy running first articles and qualification runs for new customer programmes. That work consumes capacity but generates little revenue and terrible margins. Once qualification passed, the same machines switched to mass production — and margins snapped back. This is the classic precision-machining J-curve, not a cyclical demand collapse.
Last Eight Quarters
| Quarter | Revenue (RM'000) | Gross Profit | Gross Margin | PBT | PAT | Net Margin | EPS (sen) |
|---|---|---|---|---|---|---|---|
| Q4 FY26 (Jun-26) | 35,948 | 10,745 | 29.90% | 9,738 | 7,956 | 22.14% | 1.19 |
| Q3 FY26 (Mar-26) | 30,690 | 8,248 | 26.88% | 6,759 | 5,079 | 16.55% | 0.76 |
| Q2 FY26 (Dec-25) | 25,156 | 4,830 | 19.20% | 2,478 | 1,800 | 7.16% | 0.27 |
| Q1 FY26 (Sep-25) | 25,434 | 4,324 | 17.00% | 3,917 | 3,350 | 13.17% | 0.50 |
| Q4 FY25 (Jun-25) | 32,435 | 8,644 | 26.65% | 4,510 | 3,192 | 9.84% | 0.48 |
| Q3 FY25 (Mar-25) | 34,215 | 12,140 | 35.48% | 9,729 | 7,644 | 22.34% | 1.14 |
| Q2 FY25 (Dec-24) | 33,198 | 10,720 | 32.29% | 13,308 | 10,470 | 31.54% | 1.56 |
| Q1 FY25 (Sep-24) | 29,293 | 8,430 | 28.78% | 2,988 | 2,284 | 7.80% | 0.34 |
Balance Sheet: Among the Strongest on Bursa
| Item (30 Jun 2026) | RM'000 |
|---|---|
| Deposits, cash and bank balances | 170,609 |
| Other investments (current) | 30,792 |
| Deposits with licensed banks (non-current) | 930 |
| Total cash & liquid investments | 202,331 |
| Borrowings (current + non-current) | (481) |
| Lease liabilities | (1,556) |
| NET CASH | 200,294 |
| Inventories | 45,828 |
| Receivables | 30,833 |
| Property, plant & equipment | 72,896 |
| Total current assets / current liabilities | 279,841 / 17,396 (current ratio 16.1x) |
| Shareholders' equity / NTA per share | 334,806 / RM0.4988 |
Net cash of RM200.3 million equals 29.8 sen per share — roughly 25% of the RM1.19 share price. Debt-to-equity is essentially zero.
Cash Flow — One Warning Sign
- FY26 operating cash flow: RM12.09m (FY25: RM33.84m) — only 66% cash conversion of net profit.
- FY26 capital expenditure: RM14.31m → negative free cash flow of RM2.21m.
- Dividends paid: RM10.07m — funded from reserves, not from current-year FCF.
- Main drivers: receivables up RM6.93m (consistent with a revenue ramp late in the year) and tax paid of RM7.06m.
Exclusive Gold Members Content
Get in-depth analysis, target prices, and investment recommendations with Gold Members subscription.
How to Get Gold AccessDividends
CPETECH Dividends — Small But Rising
CPETECH is not a dividend stock and should not be bought as one. But its payout record does say something about management confidence.
| Financial Year | DPS (sen) | Dividend Paid (RM'000) | Net Profit (RM'000) | Payout Ratio | Yield at RM1.19 |
|---|---|---|---|---|---|
| FY2026 | 1.50 | 10,067 | 18,185 | 55.4% | 1.26% |
| FY2025 | 1.00 | 6,713 | 23,590 | 28.5% | — |
| FY2024 | 1.15 | 7,720 | ~22,000 | ~35% | — |
Note the paradox: in a year when earnings fell 22.9%, CPETECH raised DPS from 1.00 sen to 1.50 sen — lifting the payout ratio from 28.5% to 55.4%. For most companies that is a warning sign. For CPETECH, with RM200 million of net cash on the balance sheet, it is a confidence signal: management did not view FY26 as the start of a structural decline.
Is the Dividend Sustainable?
- ✅ The RM10.07m dividend is covered 20 times over by RM200 million of net cash.
- ⚠️ FY26 free cash flow was negative RM2.21 million — the dividend was paid from reserves, not from cash generated that year.
- ⚠️ The RM65.5 million capex programme will take priority over dividends in FY27-FY28.
A 1.26% yield is far too low to attract income investors. This is a growth stock that happens to pay a small dividend — not the other way round.
Exclusive Gold Members Content
Get in-depth analysis, target prices, and investment recommendations with Gold Members subscription.
How to Get Gold AccessCPETECH Valuation
Exclusive Gold Members Content
Get in-depth analysis, target prices, and investment recommendations with Gold Members subscription.
How to Get Gold AccessPeer Comparison — Bursa Semiconductor Supply Chain
Exclusive Gold Members Content
Get in-depth analysis, target prices, and investment recommendations with Gold Members subscription.
How to Get Gold AccessRed Flags — CPETECH Risks
Exclusive Gold Members Content
Get in-depth analysis, target prices, and investment recommendations with Gold Members subscription.
How to Get Gold AccessCPETECH Investment Scorecard
Exclusive Gold Members Content
Get in-depth analysis, target prices, and investment recommendations with Gold Members subscription.
How to Get Gold AccessCatalysts — What Moves CPETECH Next
Exclusive Gold Members Content
Get in-depth analysis, target prices, and investment recommendations with Gold Members subscription.
How to Get Gold AccessConclusion — CPETECH
Exclusive Gold Members Content
Get in-depth analysis, target prices, and investment recommendations with Gold Members subscription.
How to Get Gold AccessRelated Stocks
Other stocks in the Industrial sector