Stochastic RSI Oscillator on TradingView: How to Use It Effectively
Assalamualaikum and greetings to everyone. Hope you are all in good health. Today I will be sharing another article on how to use the Stochastic Oscillator and RSI on TradingView.
Let us get your notebook and pen ready to jot down the important points.
For those who have not yet opened a TradingView account, you may refer to the article on how to register a TradingView account for the step-by-step guide.
What Does the RSI Oscillator Do?
First and foremost, you need to know the type of indicator you want to use in your stock analysis.
The function of this indicator is to identify whether a stock is overbought or oversold.
Secondly, we want to find where the divergence occurs.
How to Use the Stochastic & RSI Oscillator
As usual, to use this indicator you can go to the indicators section and search for Relative Strength Index (RSI).
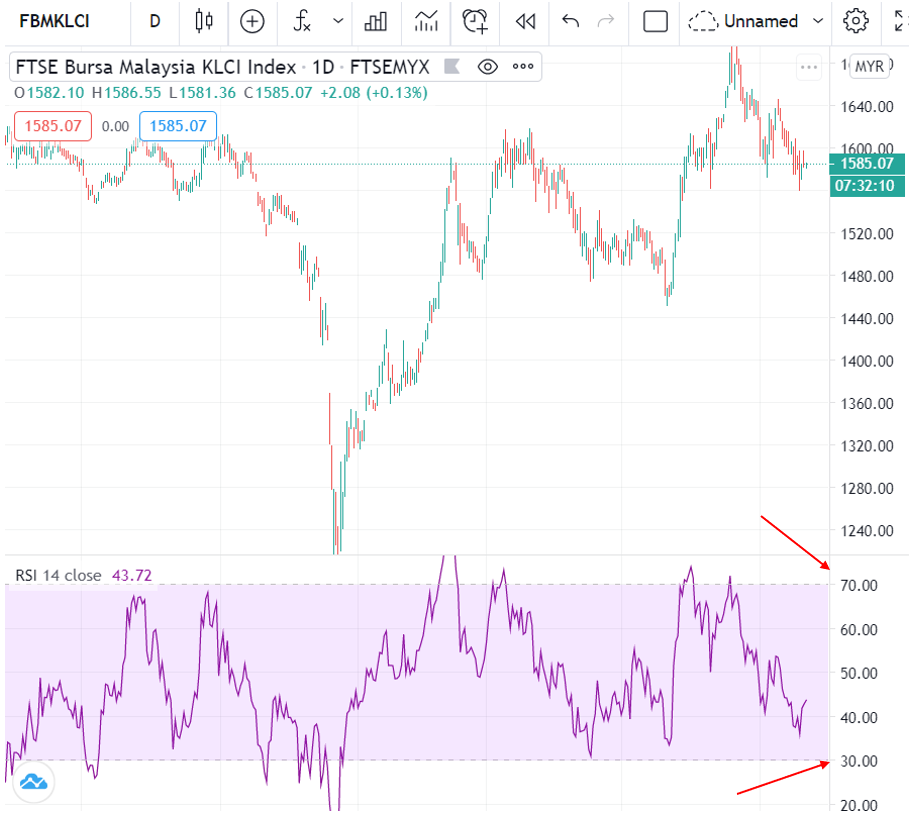
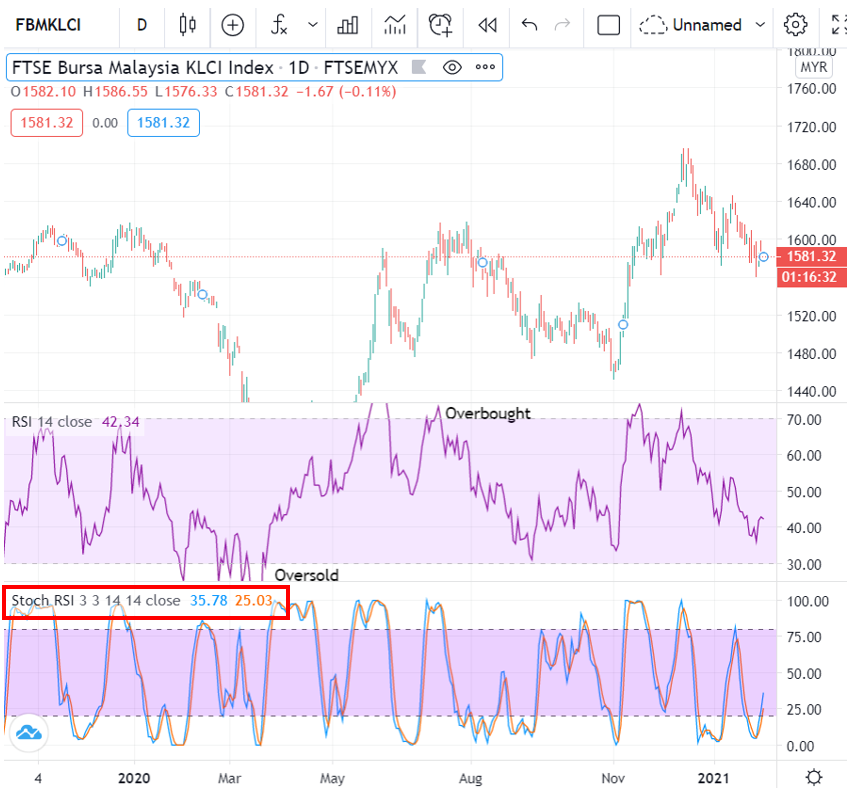
After you have selected it, an oscillator called RSI will appear as shown in the image above.
With the RSI, you can determine where the overbought or oversold conditions are.
It is quite simple!
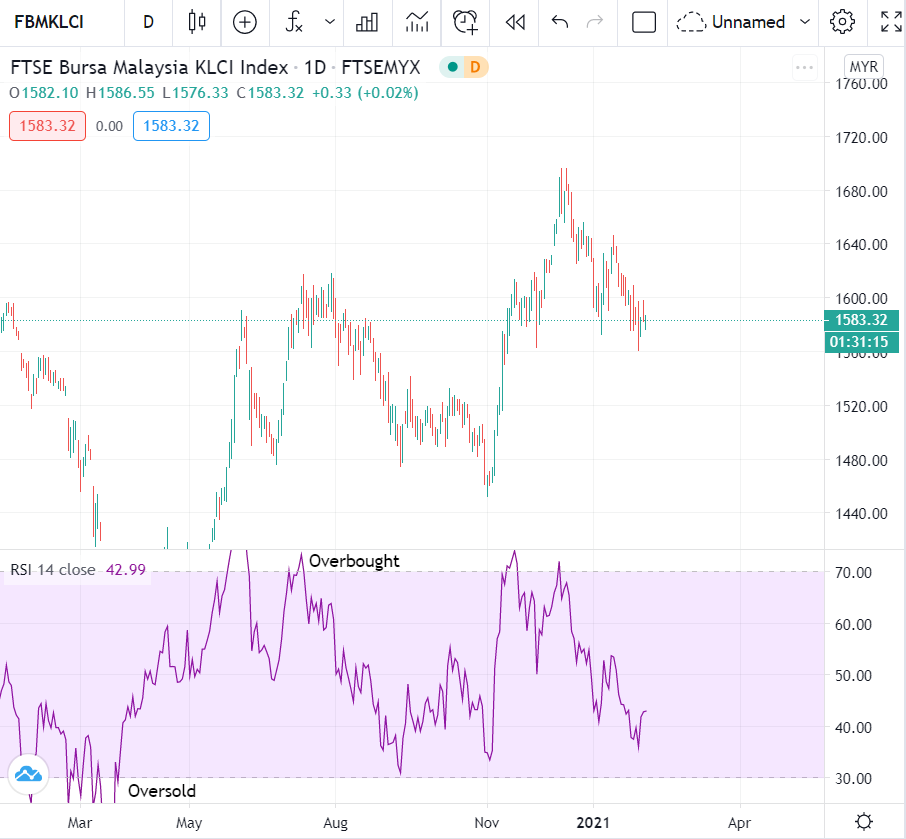
First Function: Overbought & Oversold
Can you see in TradingView that there is a line at 30 at the bottom and 70 at the top, as shown in the image above?
So when the RSI line is above 70, we call it overbought (excessive buying).
This means there is potential for the price to reach its peak.
If the RSI line is below 30, it means it is oversold. Oversold means there is excessive selling and there is potential for the price to be at the floor.
You can refer to the image below.
Second Function: Divergence
For the second function, we want to find out if there is any divergence.
Divergence is what makes an indicator become a leading indicator.
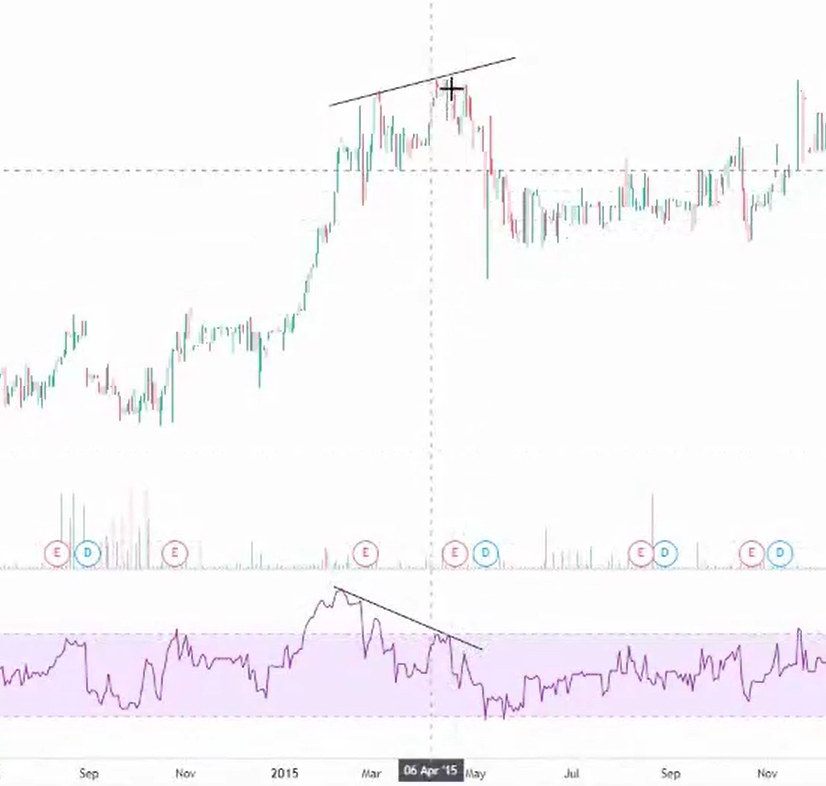
Right, have a look at the image above. I have marked where the price made a new high but the RSI indicator made a lower peak.
When we spot a divergence situation like this, we can expect the price to make a correction.
So that is the second function of the RSI oscillator — to find divergence.
Stochastic Function
Let us have a look at the Stochastic function!
Select Stochastic from the indicators and it will appear as shown in the image above.
The function and concept are more or less the same as RSI. If RSI is high, then Stochastic is also high and vice versa.
Using Stochastic, we also want to find oversold, overbought and divergence signals.
Difference Between Stochastic & RSI
What is the difference between these two?
Stochastic: More sensitive, more signals and more false signals.
RSI: Less sensitive, fewer signals and fewer false signals.
When there are fewer false signals, we tend to make more accurate decisions, but with fewer signals, we might end up buying a stock at a higher price.
Typically, the Stochastic line produces more signals so there will be many more overbought and oversold readings compared to the RSI line.
Should You Look at Stochastic or RSI for Entry?
Right, if you want to enter a trade, I would like to remind you that the Stochastic oscillator and RSI indicators are only meant as supporting tools and not the primary reason for your entry.
Primary reason/decision for entry: Always refer to support & resistance and also entry methods such as buy on breakout, BOD or buy on support.
TradingView Is a Key Component of Technical Analysis
This article is one of a series written on Technical Analysis: TradingView. Technical Analysis is one of the branches related to stock research.
There are many more topics covered in the technical analysis learning series and how you can use TradingView optimally to help with your stock research.
To view other topics related to TradingView or Technical Analysis, head over to the Complete Technical Analysis Guide.
Conclusion
In conclusion, by using the RSI and Stochastic indicators you can identify where oversold and overbought conditions are.
On top of that, you can also find divergence. Divergence is a key signal that is important for us to know.
Hope this article has been beneficial for all of you. For the full list of articles related to technical analysis, head over to the Full List of Technical Analysis Articles.
Frequently Asked Questions (FAQ)
1. What is Stochastic RSI and how does it differ from regular RSI?
Stochastic RSI is an indicator that applies the Stochastic Oscillator formula to RSI values. It is more sensitive compared to regular RSI and provides earlier overbought/oversold signals.
2. How do you read Stochastic RSI signals?
A value above 80 indicates overbought conditions while a value below 20 indicates oversold conditions. Crossovers between the K and D lines also provide buy or sell signals.
3. What is divergence in RSI and why is it important?
Divergence occurs when price movement does not align with the RSI movement. Bullish divergence indicates potential price increase, while bearish divergence indicates potential price decrease. It is important for detecting trend reversals.
4. What is the best setting for Stochastic RSI on TradingView?
The default setting of 14 periods is usually suitable for most timeframes. For day trading, some traders use shorter periods such as 9 for faster signals.
Ready to start investing? Open a CDS account with Mahersaham today and begin your investment journey. Also grab our free stock basics ebook as a beginner''s guide.