How to Use TradingView Fibonacci Tools
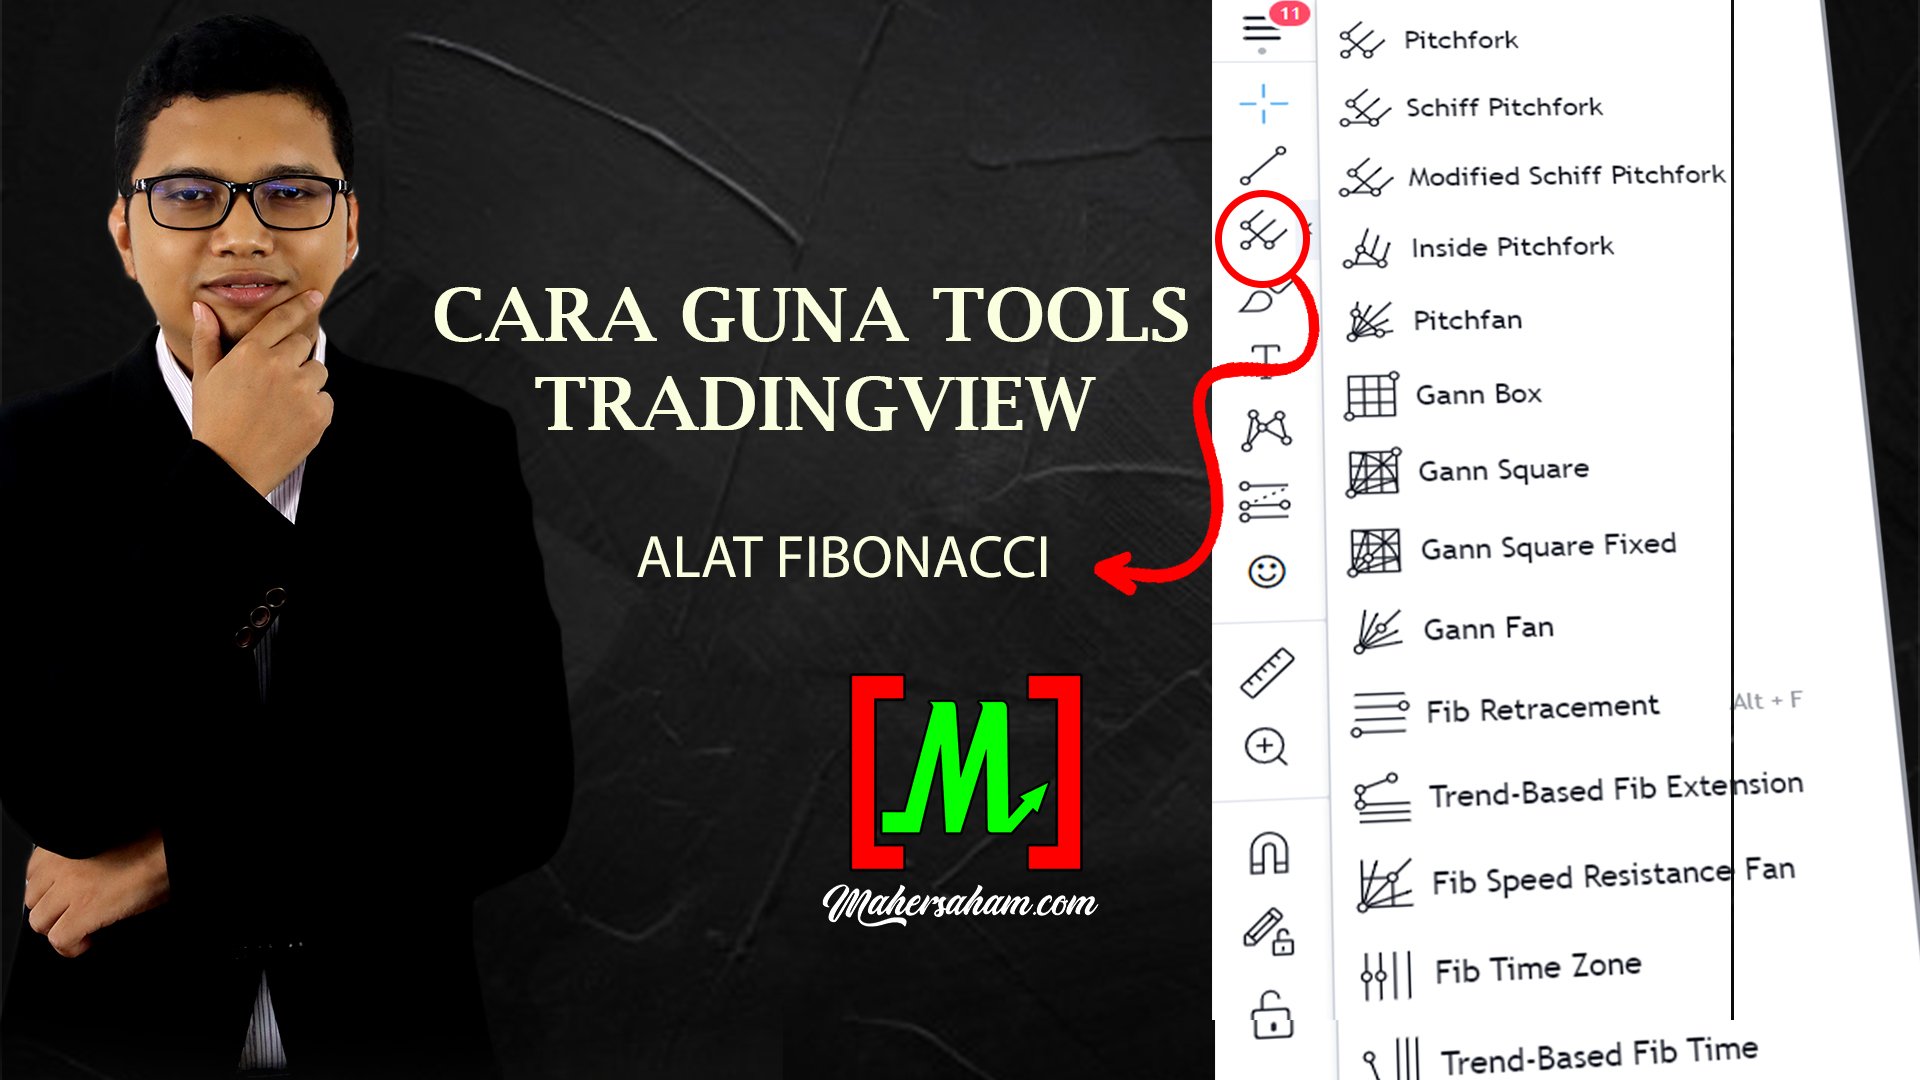
In this article, we will share how to use Fibonacci tools in TradingView for stock technical analysis.
If our previous article covered how to register a TradingView account and create your own template, this time we will focus on how to use the tools available in TradingView.
There are actually a great many tools in TradingView.
If we were to cover each one individually, your fingers would cramp from scrolling because it would be far too lengthy.
So this time, we will focus on the Fibonacci tools.
Where can you find these tools?
Let us refer to the TradingView platform — make sure you have already registered an account.
First, visit my.tradingview.com and click on Chart.
Then click the icon in the red box as shown below.
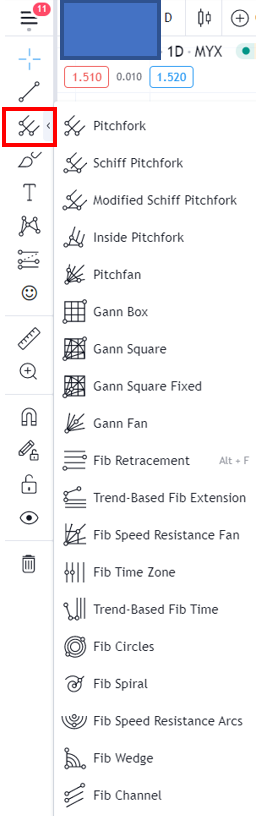
Today we will learn 4 things:
- Fibonacci Retracement
- Trend-Based Fib Extension
- Fib Time Zone
- Fib Channel
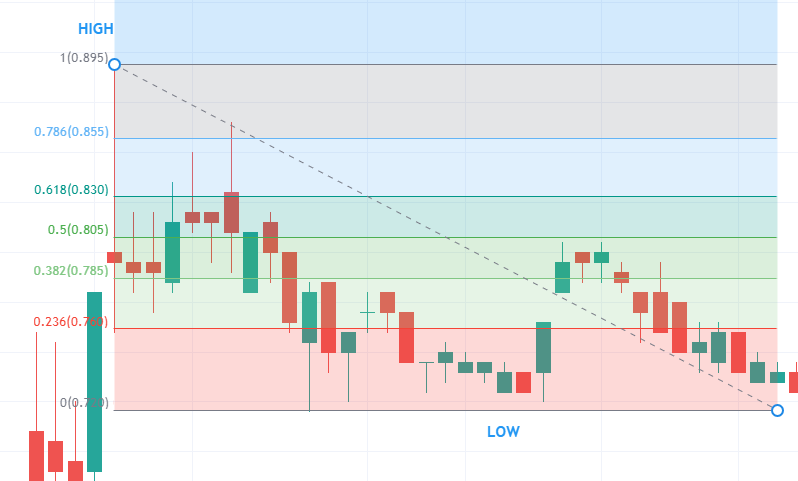
Fibonacci Retracement
What is the purpose of Fibonacci Retracement?
We use it to find support levels — the levels where a stock price is likely to stop falling.
Open any counter (stock) that you wish to analyse.
Identify the low and high points on your chart.
Then click on Fib Retracement.
In Fibonacci Retracement, there are values from 0 to 1.
Make sure the value of 1 is at the bottom for a stock that is in an uptrend.
So we click from the high to the low.
Refer to the diagram below.
You can see the stock price going up and down. As mentioned above, we want to estimate at which level the price will fall to.
Typically, stocks will fall to a maximum of the 0.618 level.
Where 0.618 is a key Fibonacci level.
If the stock falls beyond 0.618, we can consider that it is approaching the starting low point.
So we can disregard it.
Support can occur at the 0.618, 0.5, and 0.382 levels.
The price may bounce at these areas.
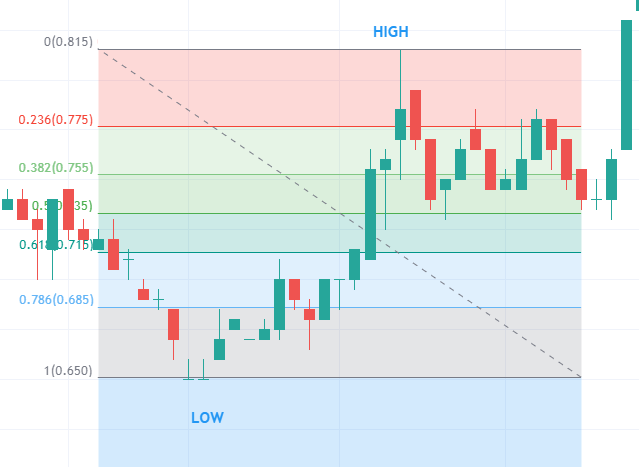
What about a stock that is in a downtrend?
It is the same as before — we identify the high and low on our chart.
This time, however, make sure the value of 0 is at the bottom for a stock in a downtrend.
So we click from the low to the high.
Refer to the diagram below.
We know that stock price movement is not a straight line — it moves in waves.
Even after falling, the price will make a pullback upwards.
After the pullback, we want to know how high the stock price can rise to.
We can observe that at the 0.618, 0.5, and 0.382 levels, bounces also occur.
In this case, initially the stock price rose to the 0.618 level and then fell back.
Subsequently, it rose again near the 0.5 level before falling once more, continuing the decline.
Trend-Based Fib Extension
The purpose of this tool is to estimate how far a stock price can go.
In other words, where to set your target price (TP).
First, you still need to identify the low and high.
Then click on the Trend-Based Fib Extension icon.
We draw from the low to the high, and then to another low point.
After that, you will see the levels that can be used as your TP.
Let us look at the example below.
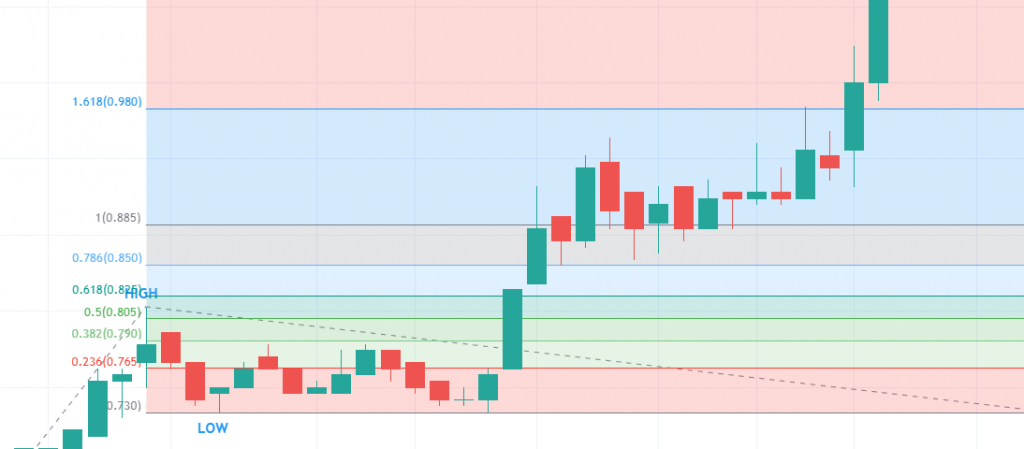
Based on the diagram above, the levels that can be used as TP are the 0.618 level, 1.0 level, and 1.618 level.
Fibonacci Time Zone
Usually, we refer to the price axis when using Fibonacci.
This time, however, we will be referring to the time axis instead.
That is the key difference when using the Fibonacci Time Zone.
For those who are not aware, this may be new knowledge for you.
Stock price movement actually follows cycles.
To obtain the Fibonacci numbers, we need to find the low and high points.
The use of Fibonacci Time Zone is to predict the next cycle based on the previous low and high.
Do bear in mind that it may not always be accurate as it involves the time factor.
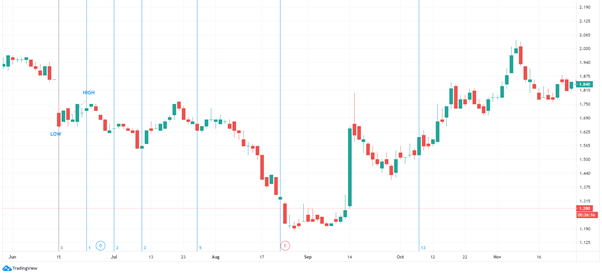
If the prediction works, it works; if it does not, it does not.
So we need to apply trial and error when doing technical analysis — it may not work straight away.
Each vertical line represents a potential area where a high, low, or reversal could occur.
Fibonacci Channel
This tool is used to estimate support and resistance levels using Fibonacci numbers.
How do we draw it?
First, we draw the trendline at the bottom (low), then drag it upwards to create the upper trendline.
Once completed, we will have two channels — the lower channel acting as support and the upper channel acting as resistance.
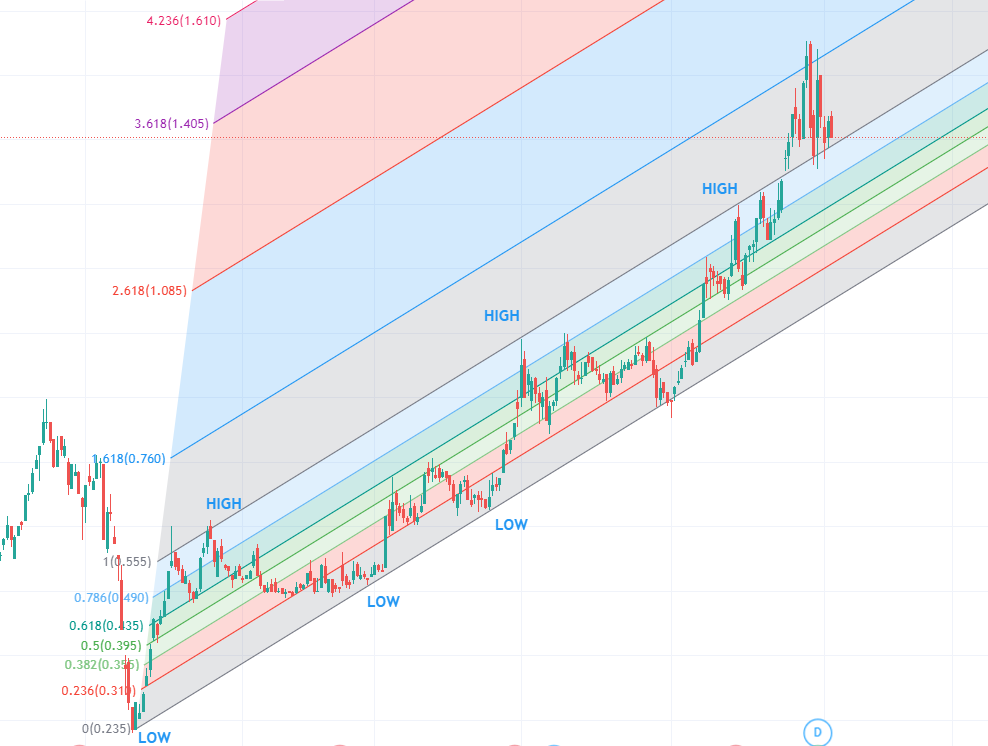
By using the Fibonacci Channel, the resulting lines are diagonal and run parallel with the highs and lows.
After drawing the Fibonacci Channel, we can predict future support and resistance levels.
Based on the case study above, we can predict that support is at the 0 level and resistance is at the 1 level.
The 1.618 level is also a resistance area.
Conclusion
There are many Fibonacci-related tools in TradingView, and you do not need to master all of them.
Knowing how to use one or two Fibonacci tools is already sufficient.
What matters most is that you understand the concept behind the tool.
Frequently Asked Questions (FAQ)
1. What are Fibonacci Tools in TradingView?
Fibonacci tools in TradingView are instruments used to identify support and resistance levels based on Fibonacci ratios such as 23.6%, 38.2%, 50%, 61.8%, and 100%.
2. What is the difference between Gann Tools and Fibonacci Tools?
Gann tools use angles and lines based on W.D. Gann''s theory to forecast price movements, whilst Fibonacci tools use mathematical ratios to determine price retracement and extension levels.
3. Do I need to master all Fibonacci tools in TradingView?
No, you do not. It is sufficient to master one or two Fibonacci tools that you understand the concept of. What matters is your understanding of how the tools function, not how many you use.
4. How does Fibonacci Retracement help with investment decisions?
Fibonacci Retracement helps identify price levels where a stock is likely to bounce or reverse, assisting investors in determining optimal entry and exit points.
Start Your Investment Journey
Now that you understand how to use Fibonacci tools in TradingView, continue your investment journey. Open a CDS account with Mahersaham and start conducting your own technical analysis. Do not forget to download the free Mahersaham ebook to deepen your understanding of stock investment fundamentals.