3 Indicators, 1 System: How to Combine Fibonacci, MACD & Ichimoku

Have you ever entered a position after seeing one indicator give a buy signal, only to watch the price keep falling? You are not alone. This is the most common problem for traders who rely on a single indicator. One indicator, no matter how powerful, will still produce false signals.
The reality is that no indicator is perfect. Fibonacci Retracement is great for identifying support and resistance levels, but it does not tell you the direction of momentum. MACD is excellent at reading momentum, but it does not show you critical price zones. Ichimoku Cloud is powerful for trend and dynamic support, but when used on its own, it can sometimes be slow to give signals.
So, what is the solution? Combine all three into one complete system.
This concept is called confluence - when two or more technical indicators give the same signal at the same time and at the same price level. Imagine three different experts all agreeing that a particular stock should be bought. Your confidence would certainly be much higher compared to hearing just one opinion, right?
In this article, you will learn how to combine Fibonacci Retracement, MACD, and Ichimoku Cloud into a layered trading system that is practical. This is not just theory - this is a combination of technical indicators that many professional traders use to improve the accuracy of their entries and exits.
What Is Confluence in Trading?
Before we dive into the combination technique, you need to understand the basic concept behind it: confluence.
Confluence in trading means a zone or point where several different technical signals overlap and point in the same direction. It is like multiple layers of evidence supporting a single decision. The more layers that overlap, the stronger your confidence in that trade.
Try this simple analogy: You are driving and about to enter a junction. If only one traffic light shows green, you might still need to be cautious - there could be vehicles from other directions. But if three green lights from three different directions all give you right of way, your confidence to proceed is much higher.
The same applies in trading. If Fibonacci shows a strong support level, Ichimoku confirms a bullish trend, and MACD shows momentum is in your favour - you have three "green lights" all at once. This is a confluence zone, and this is the highest quality setup for entering a position.
According to Tradeciety, confluence trading dramatically increases the probability of success because it filters out the false signals that commonly arise from using a single indicator alone. Instead of relying on one perspective, you get confirmation from multiple dimensions of analysis - trend, momentum, and price level.
The principle is simple: the more technical factors that agree, the lower the risk that your trade turns out to be a false signal. Let us get to know each indicator we will be combining, one by one.
Fibonacci Retracement: Determine Support & Resistance Levels
Fibonacci Retracement is a technical tool used to identify where price is most likely to pause, bounce, or reverse during a pullback. It is based on the famous Fibonacci ratios found in mathematics and nature.
The key levels you need to remember are:
- 38.2% - shallow pullback, very strong trend
- 50% - a psychological level that the market often respects
- 61.8% - the "Golden Ratio", the most important level and frequently a price turning point
Drawing Fibonacci Retracement is quite straightforward. For an uptrend, you draw a line from the swing low (lowest point) to the swing high (highest point). For a downtrend, reverse it - from swing high to swing low. Trading platforms such as TradingView or MetaTrader have built-in Fibonacci tools that you can use automatically.
What does Fibonacci actually tell you? It tells you where price is likely to pause during a pullback. In other words, it helps you identify high-potential entry zones. If price is in an uptrend and pulls back to the 50% or 61.8% level, there is a strong chance that price will bounce back up from there.
However, Fibonacci alone is not enough. It only tells you where to enter, but not when to enter or whether momentum supports that entry. This is where we need additional layers. For a deeper understanding of how to draw and interpret Fibonacci, read the complete guide on Cara Guna Fibonacci Retracement.
MACD: Confirm Momentum and Direction
MACD, or Moving Average Convergence Divergence, is a momentum indicator that shows the relationship between two moving averages of price. According to Investopedia, MACD is one of the most popular and versatile technical indicators in the world.
MACD consists of three main components:
- MACD Line - the difference between EMA 12 and EMA 26 (Exponential Moving Average)
- Signal Line - the EMA 9 of the MACD Line, acting as a signal trigger
- Histogram - a bar chart showing the distance between the MACD Line and Signal Line
The most basic signal from MACD is the crossover. When the MACD Line crosses above the Signal Line, it is called a bullish crossover - a signal that momentum is shifting in a positive direction. Conversely, when the MACD Line crosses below the Signal Line, it is called a bearish crossover - momentum is weakening.
The histogram also provides very useful additional information. When the histogram is expanding (bars getting taller), it means momentum is getting stronger. When the histogram is contracting (bars getting shorter), it means momentum is losing steam. Changes in histogram size often give early warnings before a crossover occurs.
MACD is extremely powerful for confirming whether momentum supports the direction of your trade. But like Fibonacci, it has weaknesses - MACD can give false signals especially in sideways or choppy markets. To learn more about using MACD correctly, refer to the article MACD Indicator - Cara Guna Dalam Kajian Saham.
Ichimoku Cloud: Read Trends & Dynamic Support Zones
Ichimoku Kinko Hyo, more commonly known as Ichimoku Cloud, is a complete technical analysis system from Japan. Unlike most other indicators that only measure one aspect, Ichimoku provides a comprehensive picture of trend, momentum, support, resistance, and entry/exit signals - all in a single view.
The main Ichimoku components you need to know:
- Tenkan-Sen (Conversion Line) - 9-period average, shows short-term momentum
- Kijun-Sen (Base Line) - 26-period average, shows medium-term trend
- Kumo (Cloud) - the cloud formed between Senkou Span A and Senkou Span B, acting as a dynamic support or resistance zone
- Chikou Span (Lagging Span) - closing price plotted 26 periods back, used for trend confirmation
The basic Ichimoku rules are easy to understand. When price is above the cloud, the trend is bullish. When price is below the cloud, the trend is bearish. When price is inside the cloud, the market is uncertain and you should be cautious.
The biggest advantage of Ichimoku Cloud is its function as dynamic support and resistance. Unlike static Fibonacci lines, the Kumo moves with price and is constantly changing. A thick cloud indicates strong support or resistance, while a thin cloud indicates weakness and is likely to be broken through easily.
Additionally, crossovers between Tenkan-Sen and Kijun-Sen also provide important signals. Tenkan crossing above Kijun indicates bullish momentum, and vice versa for bearish. For a complete guide on the Ichimoku system, please read Ichimoku Cloud Sebagai Sistem Penuh.
The 3-Layer Combination Technique: Fibonacci + MACD + Ichimoku
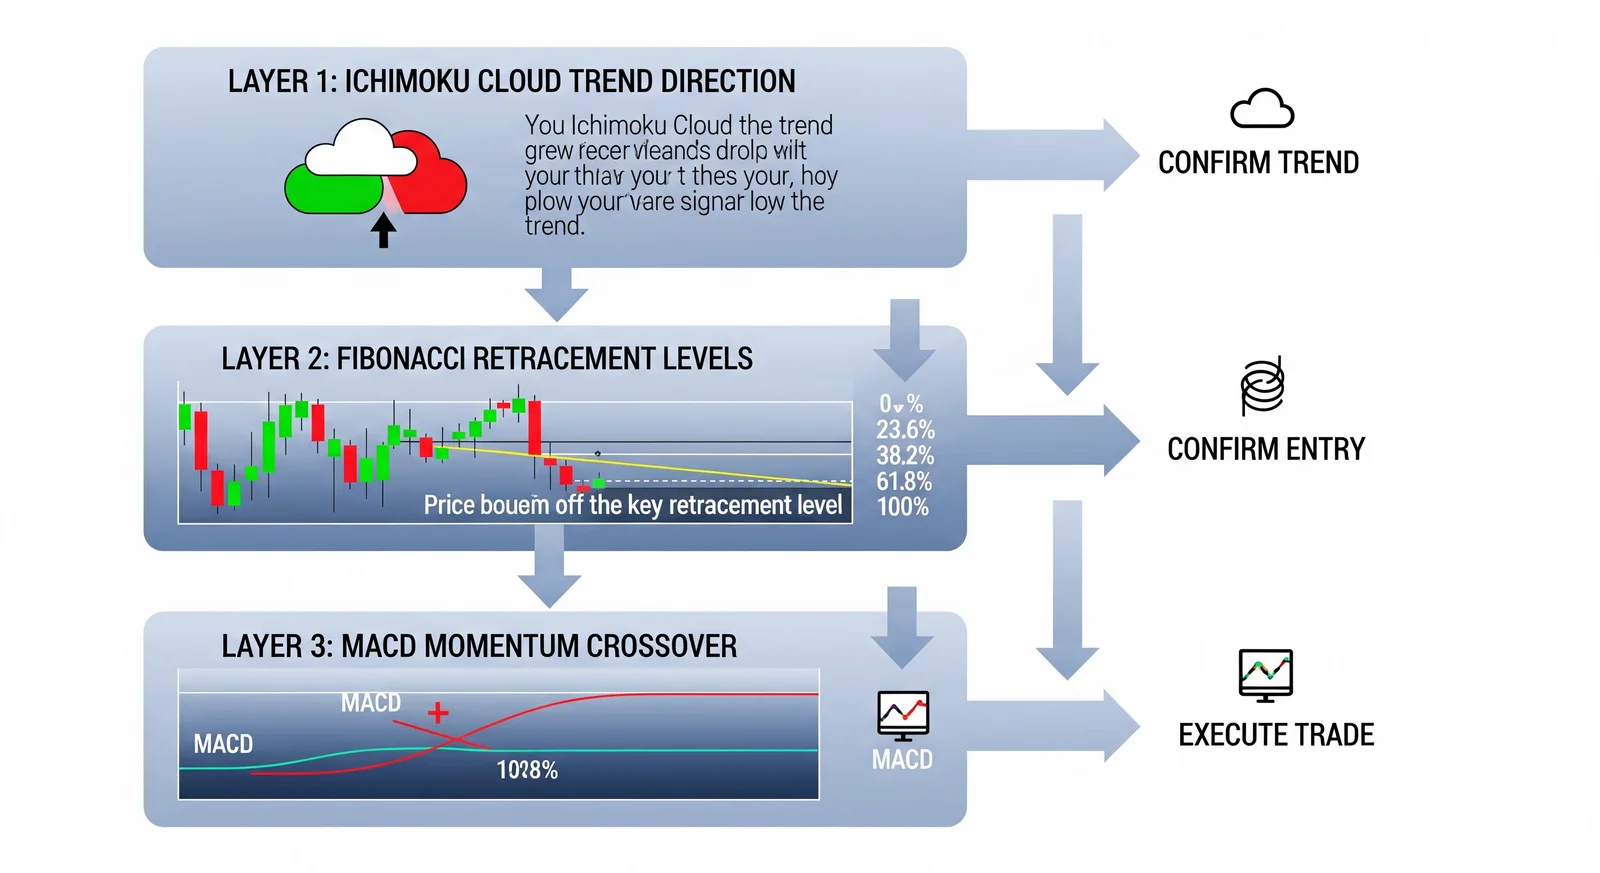
Now that we understand each indicator individually, let us combine all three into a systematic trading system. This approach uses the concept of 3 layers of confirmation - each layer has a specific role in the decision-making process.
Layer 1 - Ichimoku Determines Trend Direction
The first step always begins with Ichimoku Cloud. Why? Because Ichimoku tells you the most important thing in trading - the current trend direction. Without knowing the trend direction, all other analysis becomes meaningless.
Check the following:
- Is price above or below the Kumo (cloud)?
- Is Tenkan-Sen above Kijun-Sen (bullish) or below (bearish)?
- Is the future Kumo coloured green (bullish) or red (bearish)?
- Is the cloud thick (strong trend) or thin (weak trend)?
The rule is strict: if Ichimoku shows a bullish trend, you only look for buy opportunities. If bearish, you only look for sell or exit opportunities. Do not fight the trend shown by Ichimoku. This is your first filter that will save you from many losses.
Layer 2 - Fibonacci Determines Entry Level
Once you know the trend direction from Ichimoku, the next step is to use Fibonacci Retracement to identify precise entry levels. Draw Fibonacci from the relevant swing point - swing low to swing high for an uptrend.
This is where the magic of confluence happens. Look for Fibonacci levels that overlap with Ichimoku components:
- Does the 50% or 61.8% Fibonacci level overlap with Kijun-Sen?
- Does the Fibonacci level overlap with the upper edge of the Kumo (Senkou Span A)?
- Does the Fibonacci level overlap with Tenkan-Sen?
When a Fibonacci level overlaps with one of the Ichimoku components, that zone becomes a confluence zone - an area where the probability of price bouncing is significantly higher. This is not just a single support line; this is a zone where two different types of analysis agree that price should react.
Layer 3 - Full Ichimoku Confirmation (not MACD)
You already know the direction. You already know where to enter. The third layer should answer one question only: is the trend structure still intact at the moment you want to enter?
We used to put a MACD crossover here. After testing this system against 24 years of Bursa Malaysia data, we changed it. The reason is in the next section, and the numbers are not comfortable reading.
At the Fibonacci zone you have identified, the third condition is that Ichimoku is still fully bullish:
- Price is still above the Kumo, not merely touching it
- Tenkan-sen is still above Kijun-sen
- Senkou Span A is above Span B, meaning the forward Kumo is still green
- Chikou Span is not trapped inside past candle bodies
If all four are still true while price sits inside the Fibonacci zone, that is your setup. If one has broken, the zone stays a zone - not a signal.
Where is MACD still useful? Not as an entry trigger. MACD works better as an exit warning: once you are in a position and the histogram starts shrinking while price is still rising, momentum is draining. Use it to tighten your stop, not to open a position.
One more thing: in our tests, the useful form of MACD was divergence, not crossover - and even then only in US markets. On Bursa, both failed.
We Tested This System on 24 Years of Data. Here Are the Results.
Plenty of people teach indicator combinations. Few show evidence. We tested this system ourselves across 1,024 Bursa Malaysia counters from 2002 to 2026, covering 38.1 million signal events.
The method is simple and open to challenge: enter at the open the day after a signal, exit at the close 5, 10 and 20 days later. Every result is measured against a baseline - what you would have earned buying a random counter in the same market over the same period. If a signal cannot beat that baseline, it has no value even when it looks profitable.
Bursa 20-day baseline: +0.26% for 2002-2020 and -0.15% for 2021-2026. Baseline win rate: 42.2%.
Finding one: the 61.8% Fibonacci zone does not work on its own on Bursa
| What we tested | Avg 20-day | Win rate |
|---|---|---|
| Price inside the 61.8% zone, 3-month swing | -0.21% | 40.7% |
| Price inside the 61.8% zone, 6-month swing | -0.19% | 40.9% |
| Price inside the 61.8% zone, 1-year swing | -0.30% | 41.4% |
All seven variations we tested failed. Win rates of 39% to 42%, all below the 42.2% baseline. In other words: buying purely because price reached 61.8% performed worse than picking counters at random.
Finding two: the confluence-zone idea does not help on Bursa
We teach that when retracements measured from different swings overlap, the zone is stronger. We tested it literally - computing the 61.8% zone from 3-month, 6-month and 1-year swings, then looking for where they overlap.
It was not better. The strictest version, where all three overlap, returned +0.46% on older data but -0.67% on newer data. Flipping sign between two periods like that is a classic sign of something over-fitted to history. On NYSE it works. On Bursa it does not.
Finding three: MACD makes the setup worse on Bursa
| Fibonacci zone combined with | Avg 20-day | Win rate |
|---|---|---|
| nothing, zone alone | -0.22% | 40.8% |
| MACD crossover | -0.72% | 38.0% |
| Full Ichimoku bullish | +1.97% | 43.1% |
We tested 26 different combinations pairing the Fibonacci zone with various MACD signal forms on Bursa. Not one passed. Every single one was negative, with win rates between 32% and 41%.
By contrast, pairing the Fibonacci zone with full Ichimoku confirmation produced positive results that stayed positive across all three holding periods. The best large-sample combination - the 61.8% zone on a 3-month swing together with full Ichimoku bullish, across 1,165 events in the newer data - returned +2.42% above baseline with a 46.4% win rate.
So the order is not Ichimoku, Fibonacci, MACD. It is Ichimoku, Fibonacci, Ichimoku again. MACD loses its place as the trigger.
Want to see which counters meet the Ichimoku condition today? The Mahersaham screener filters Bursa daily for exactly this state. Start with the Ichimoku Perfect Bullish screener - this is the precise condition that produced the +1.97% in the table above. From that list, open each counter's chart and check for yourself whether price is sitting inside the 61.8% Fibonacci zone. The screener gives you a shortlist; the decision stays yours.
If you want a looser filter, Ichimoku Bounce Off Cloud catches price rebounding off the Kumo - that combination also passed our tests across all three holding periods. The full list is on the screener page.
What you should take from this: do not trust a trading system just because its logic sounds reasonable. Combining trend, momentum and price levels sounds sensible, which is exactly why it is taught everywhere. But Bursa Malaysia is not the forex market and it is not NASDAQ. Test it yourself, or at minimum ask whoever is teaching you: how much data have you tested this on?
The limits of this study, stated plainly: the prices we used are not adjusted for bonus issues and splits, so moves above 300% were filtered out as artifacts. Delisted counters are absent from the data, so there is survivorship bias. We tested 1,759 combinations, and across that many attempts some of the passes will be luck. The figures above are candidates for further study, not guarantees.
Practical Example: Buy Setup Using 3 Indicators
Let us walk through a hypothetical scenario step by step so you can see how this system works in actual practice.
Step 1: Check Ichimoku (Trend Direction)
You open a daily chart of a stock and observe the Ichimoku Cloud. Price is above the Kumo with a comfortable distance. Tenkan-Sen is above Kijun-Sen. The future cloud is coloured green and fairly thick. All of this confirms that the current trend is bullish. Decision: you will only look for buy opportunities.
Step 2: Determine Entry Level with Fibonacci
Price has just made a new swing high and is now pulling back (temporarily declining). You draw Fibonacci Retracement from the most recent swing low to that swing high. You notice that the 50% and 61.8% levels are close together. Even more interesting - the 50% Fibonacci level overlaps exactly with the Kijun-Sen line. This is a confluence zone. You mark the area between 50%-61.8% as a potential entry zone.
Step 3: Wait for MACD Confirmation
Price reaches your confluence zone. You look at MACD. The histogram that was previously negative is now starting to contract - the red bars are getting shorter. Then, the MACD Line crosses above the Signal Line - a bullish crossover occurs precisely when price is at the confluence zone. The histogram turns positive and starts expanding. Momentum is now on your side.
Step 4: Entry, Stop Loss, and Target
You enter a buy position at the confluence zone (around the 50% Fibonacci level). Stop loss is placed slightly below the 61.8% level or below the lower edge of the Kumo - whichever is lower. The first profit target is the previous swing high. The second target can use Fibonacci extension at 127.2% or 161.8%.
According to Bollinger Band Trader, backtesting the combination of MACD and Ichimoku over 100 times showed a significant improvement in consistency compared to using a single indicator alone. With the addition of Fibonacci as a third layer, entry zones become even more precise.
Exits: Stop Loss, Profit Targets and Position Size
Everything above is about getting in. This section is what actually determines whether you stay in the game.
Stop loss. Place it below the swing low your Fibonacci measurement is based on, or below the Kijun-sen - whichever sits closer to current price. The reason: if price falls below Kijun-sen, your original premise of a bullish Ichimoku is no longer true. There is no point defending a Fibonacci level once the reason for entering has gone.
Profit targets. Use Fibonacci extensions rather than round numbers:
- Release half the position at the 1.272 level
- Release a quarter at the 1.618 level
- Trail the final quarter with Kijun-sen until it is hit
Setup invalidation. If price closes back inside the Kumo, the setup is dead. Exit even if your stop loss has not been hit and even if you are not yet in profit. Waiting a little longer on a broken setup is the most common way a small account becomes a smaller one.
Position size. Decide first what percentage of capital you are willing to lose on a single trade, then calculate lot size from the stop distance - not the other way around. If the gap between entry and stop loss is 8%, and you are only willing to risk 1% of capital, then that position cannot exceed 12.5% of your capital. A wider stop means a smaller position, not a moved stop.
Keep this in mind: the best win rate we found was only 46.4%. That means you will be wrong more often than right. This system is profitable because the wins are larger than the losses, and that only holds if you genuinely cut the losses.
When NOT to Enter Even If One Indicator Gives a Signal
This technical indicator combination system is powerful, but it will also tell you when NOT to enter - and this is just as important as knowing when to enter. Here are situations where you should stay on the sidelines even if one of the indicators shows an attractive signal.
Situation 1: Ichimoku bearish but MACD bullish crossover
MACD may be showing a bullish crossover, but if price is still below the Kumo and Tenkan is below Kijun, this is most likely just a pullback within a downtrend. Do not get trapped by a short-term momentum signal that contradicts the main trend.
Situation 2: Fibonacci level is spot on but Ichimoku cloud is flat and thin
When the Kumo is very thin or flat, it indicates a market that has no clear direction. In this condition, even if price is at a beautiful Fibonacci level, the risk of whipsaw (false signal) is high. Wait until the cloud starts thickening and showing direction.
Situation 3: MACD divergence but price is still inside the cloud
MACD divergence (price makes a lower low but MACD makes a higher low) is usually a strong reversal signal. But if price is still inside the Kumo, the market is still in a phase of confusion. Wait for price to exit the cloud first before acting.
Golden rule: A minimum of 2 out of 3 indicators must agree before you enter a position. The ideal situation is when all three point in the same direction. If only one indicator gives a signal, that is not a trade - that is merely an invitation to wait more patiently.
To further improve accuracy, you can also use the Multiple Timeframe dan Index Analysis approach to confirm the trend on a larger timeframe before entering on a smaller timeframe.
5 Common Mistakes When Combining Indicators
Although the concept of combining technical indicators looks simple, many traders still make mistakes that can reduce the effectiveness of this system. Here are the five most common mistakes you need to avoid.
1. Using too many indicators
Some traders place 6-7 indicators on their chart, thinking more means better. The reality is that more than 3 indicators usually results in analysis paralysis - you become confused because there is too much conflicting information. Three indicators are sufficient if each measures a different aspect: trend (Ichimoku), price level (Fibonacci), and momentum (MACD).
2. Ignoring the bigger trend shown by Ichimoku
This is the most costly mistake. Many traders get overly excited when they see a MACD crossover or price reaching a Fibonacci level, and they forget to check the bigger trend. Ichimoku Cloud should be your first filter - not an afterthought. If the cloud says bearish, do not look for buys.
3. Entering without waiting for confluence to occur
Patience is key. Sometimes price reaches a Fibonacci level but MACD has not given a crossover yet. Or MACD has already crossed over but price has not reached the confluence zone. Impatient traders will enter early and often get stopped out. Wait until at least two, ideally three, layers of confirmation are in place.
4. Placing stop loss too tight without referencing Fibonacci or Kumo
Stop loss must have a technical basis. Place stop loss below the relevant Fibonacci level (for example below 61.8%) or below the edge of the Kumo. Do not place stop loss based on an arbitrary percentage like "2% from entry price" without referencing the chart.
5. Switching indicators after a loss (indicator hopping)
After experiencing several consecutive losses, many traders start switching indicators - from MACD to RSI, from Ichimoku to Bollinger Bands. This is called indicator hopping and it is extremely destructive. No system wins 100% of the time. What matters is consistency and discipline in following a system that you have tested. For more guidance on choosing suitable indicators, refer to Indicator Trading Terbaik.
Frequently Asked Questions (FAQ)
Can I use other indicators besides these 3?
Absolutely. You can replace any indicator with an alternative that measures a similar aspect. For example, RSI can replace MACD as a momentum confirmer, or Bollinger Bands can replace Ichimoku for dynamic support. The key is to have one indicator for trend, one for price levels, and one for momentum. Do not use two indicators that measure the same thing because that produces redundancy, not confluence.
What timeframe is this combination suitable for?
The combination of Fibonacci, MACD, and Ichimoku works on all timeframes - from 15-minute charts to weekly charts. However, it is most effective on daily and 4-hour (H4) charts because signals are cleaner and there is less noise. For smaller timeframes like 5 or 15 minutes, you may get more false signals and need to use adjusted indicator settings.
Do all three indicators need to agree before entering?
Ideally, yes. But in actual practice, you can enter when at least 2 out of 3 indicators agree, provided the third indicator is not actively giving a contradictory signal. For example, if Ichimoku is bullish and Fibonacci shows a strong support zone, but MACD is still neutral (no crossover yet but not bearish), you can enter with a smaller position size.
Is this combination suitable for Bursa Malaysia stocks?
Yes, very much so. Stocks on Bursa Malaysia, especially those with high trading volume such as stocks in the KLCI or FBMEMAS index, respond well to technical analysis. Fibonacci, MACD, and Ichimoku all work just as well on local stocks as they do on international stocks. Just make sure you focus on stocks with sufficient liquidity - avoid stocks that are too illiquid because technical signals are less reliable on such stocks.
How long does it take to master this technique?
Realistically, you need at least 2-3 months to understand each indicator individually and an additional 1-2 months to become proficient at combining all three. It is recommended that you practise first using a demo account or paper trading before using real capital. The key is not the speed of learning, but the consistency of practice.
Can I use this combination for forex or crypto?
Yes. The principles of technical analysis are universal and can be applied to any financial instrument that has a price chart - including forex, cryptocurrency, commodities, and indices. In fact, this combination is frequently used by professional forex traders because the forex market has very high liquidity, making technical signals more reliable.
What is the difference between confluence and confirmation?
Confluence means several different signals overlap at the same price zone at the same time. Confirmation means one signal comes after another sequentially to validate a decision. In this 3-layer system, you are actually using both concepts: Fibonacci and Ichimoku provide confluence (overlapping at the same zone), while MACD provides confirmation (confirming momentum after price reaches that zone).
What are the optimal settings for each indicator?
For starters, use the default settings that have been proven effective - standard Fibonacci (23.6%, 38.2%, 50%, 61.8%, 78.6%), MACD (12, 26, 9), and Ichimoku (9, 26, 52). These default settings have been tested for decades and work well in most markets. Only change settings when you have sufficient experience and have backtesting data to support the changes.
Why was MACD removed as an entry signal?
Because our tests across 38.1 million events on Bursa Malaysia showed the Fibonacci zone paired with a MACD crossover returned -0.72% against baseline with a 38% win rate, versus +1.97% when paired with full Ichimoku confirmation. We tested 26 MACD variations and none passed. MACD remains useful for tightening a stop, not for opening a position.
Do these results apply to US stocks too?
No. On NYSE, the Fibonacci zone paired with MACD divergence - not crossover - returned +1.29% above baseline with a 58.9% win rate across 712 events. Bursa and the US behave differently, and applying one market's tactics to another is among the most expensive mistakes in technical analysis.
If the win rate is only 46%, how can it be profitable?
Because the size of the wins exceeds the size of the losses. A system with a 46% win rate but an average win twice the average loss is still profitable. This is why stop losses and position sizing matter more than hunting for a more accurate entry signal.
Can I use the 61.8% Fibonacci zone without Ichimoku?
You can, but our data says do not. All seven Fibonacci zone variations tested in isolation produced win rates of 39% to 42%, below the market baseline of 42.2%. The zone tells you where to look, not when to act.
Conclusion
Combining Fibonacci Retracement, MACD, and Ichimoku Cloud into a layered system gives you a significant edge compared to using a single indicator alone. Each indicator fills the weaknesses of the others - Ichimoku determines direction, Fibonacci determines location, and MACD confirms timing. When all three agree, you have a high-conviction setup with more controlled risk.
Remember, no system is perfect and losses will still occur. But with this technical indicator combination approach, you will make decisions based on stronger evidence, not just guesses or feelings.
If you are serious about practising this 3-layer combination technique on real stocks, the first step is to make sure you have the right platform to start your investment journey.
Open your CDS trading account to start investing on Bursa Malaysia as well as international markets such as the US and Hong Kong.
Download our free stock market basics ebook.