How to Analyse Stocks Using 11 Most Powerful Candlestick Patterns

Candlestick patterns are a widely used method of analysing stocks using candlestick charts.
Candlesticks not only provide clear information about the price of a stock being traded, but also offer insight into the psychology behind market movements during trading sessions.
Candlestick analysis is often one of the first things a person learns right after they open a CDS account to invest in stocks and begin studying technical analysis.
What Is a Candlestick?
Candlestick analysis originated in Japan.
To learn about the history and origins of candlesticks, visit The History and Importance of Candlesticks.
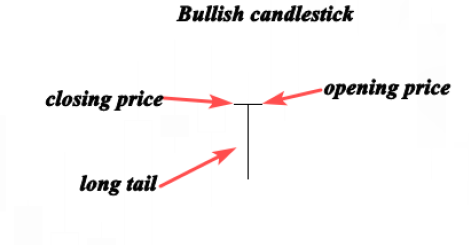
A candlestick is formed from the "OPEN", "HIGH", "LOW & CLOSE" prices based on the time frame we use.
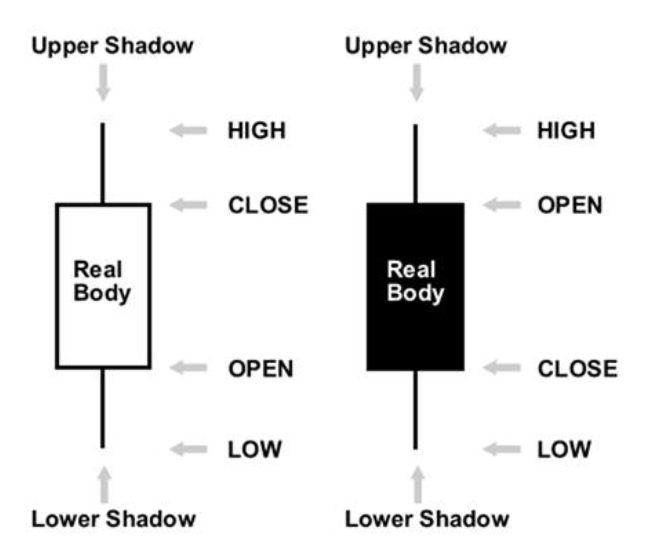
If the CLOSE is above the OPEN, the candle is considered BULLISH, meaning the market is trending upwards. A bullish candle is typically represented by a WHITE CANDLESTICK.
Most platforms use a WHITE CANDLE to indicate a BULLISH MARKET, but this is not a strict requirement. Some platforms use different colours. It depends on your personal preference.
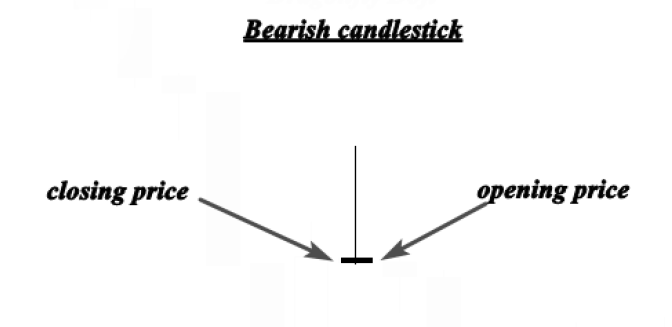
Conversely, if the CLOSE is below the OPEN, the candle is considered BEARISH, meaning the market is trending downwards.
Body Size Differences
A long body indicates STRONG BUYING or SELLING PRESSURE.
If a candle closes above the open with a long body, it means BUYERS are stronger and have taken control of the market during that period.
Conversely, if a BEARISH candle has the OPEN above the CLOSE with a long body, it means SELLING PRESSURE is controlling the market during that period.
A short and small body indicates minimal buying or selling activity.
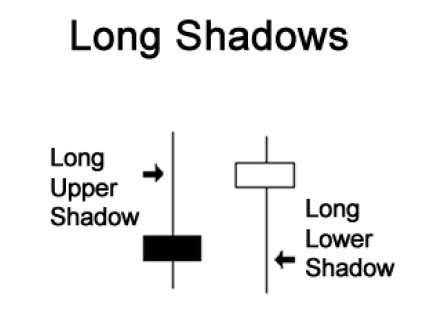
Shadows provide us with important information about the market.
We can learn a great deal about market behaviour from the SHADOW.
- The upper shadow indicates the high of the trading session
- The lower shadow indicates the low of the trading session
A candle with SHORT SHADOWS shows that most of the "TRADING ACTION" occurred only around the OPEN and CLOSE area.
Candlestick Patterns
Candlestick patterns are one of the most powerful trading concepts. They are easy to identify and represent profitable trading setups.
Research has confirmed that these patterns have high predictive value.
Candlestick patterns are like a language that helps us understand what has happened in the market.
Here are the patterns we will cover:
- The Bearish Engulfing Bar Pattern
- The Bullish Engulfing Bar Pattern
- The Doji Candlestick Pattern
- The Dragonfly Doji Pattern
- The Gravestone Doji
- The Morning Star
- The Evening Star Pattern
- The Hammer (Pin Bar)
- The Shooting Star (Bearish Pin Bar)
- The Harami Pattern (The Inside Bar)
- The Tweezers Tops and Bottoms
The Engulfing Bar Candlestick Pattern
This pattern forms when a candle fully engulfs the previous candle.
The engulfing bar can engulf more than one previous candle.
However, an engulfing bar must fully consume at least one candle to be valid.
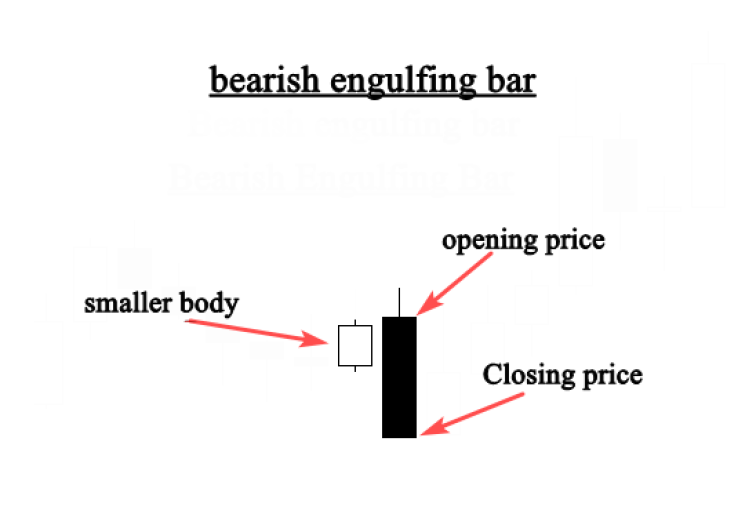
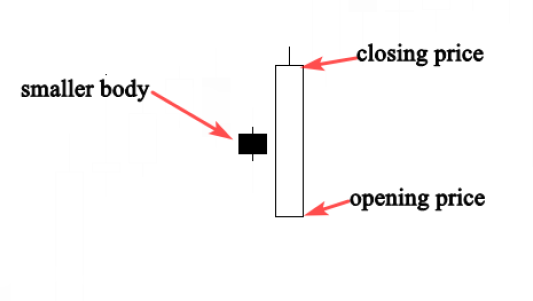
The engulfing bar is one of the most important candlestick patterns. This pattern consists of 2 bodies:
The first body is smaller than the second. In other words, the second body engulfs the first. See the image below.
This is how the engulfing bar appears on a chart.
When a bearish engulfing bar forms, it tells us that sellers are controlling the market.
When this pattern occurs at the end of an uptrend, it signals that buyers have been overwhelmed by sellers, indicating a potential trend reversal.
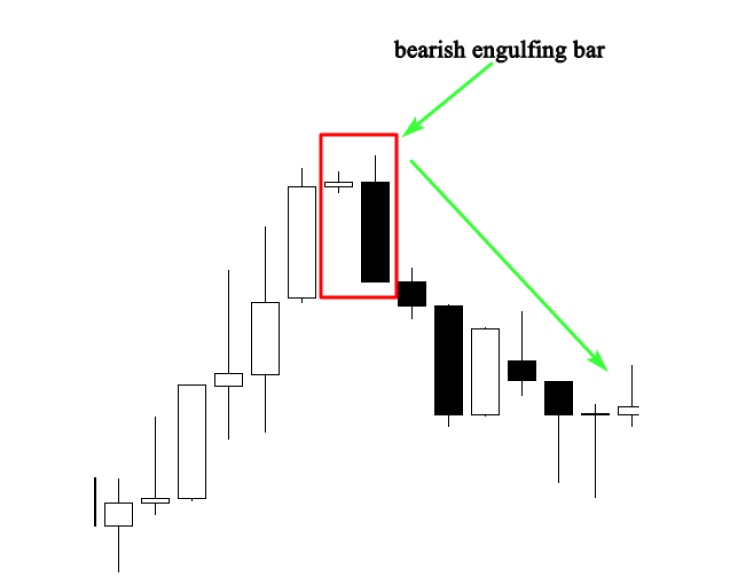
As shown in the image, a Bearish Engulfing pattern formed at the end of an uptrend.
From here, we can anticipate a TREND REVERSAL because buyers are no longer in control and sellers are pushing the market downwards.
The Bullish Engulfing Bar Pattern
This pattern has 2 candles: the first has a small body and the second is an engulfing candle, as shown in the image below.
A bullish engulfing bar tells us the market is no longer under the control of sellers and buyers are about to dominate.
When a bullish engulfing candle forms during an UPTREND, it signals continuation. When it forms during a DOWNTREND, a trend reversal to the upside is likely.
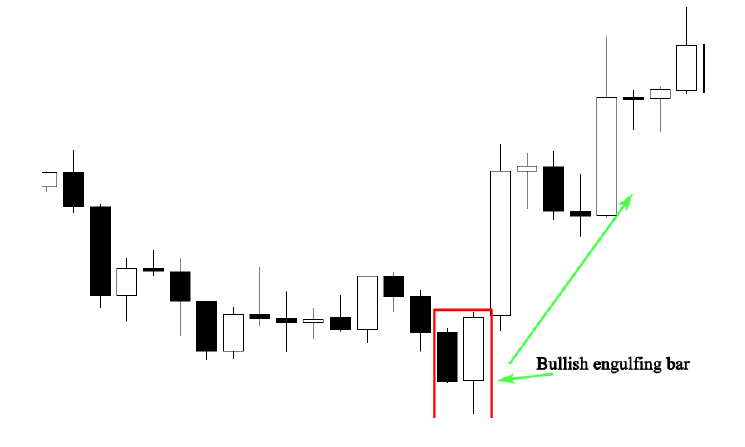
The chart above shows how the market changed direction after the formation of a bullish engulfing bar pattern.
The small body represents selling power being overcome by the second body, which represents buying power.
The Doji Candlestick Pattern
The Doji is one of the most important candles. When this pattern forms, it tells us that the market opened and closed at the same price, signalling equality and indecision between buyers and sellers.
This indicates that no one is in control of the market.
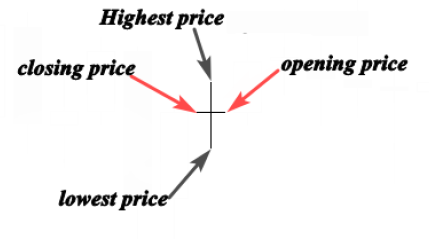
As shown in the image, the OPENING and CLOSING prices are the same. This signals that the market has no specific direction.
When this pattern appears in an uptrend or downtrend, it suggests a possible market reversal.
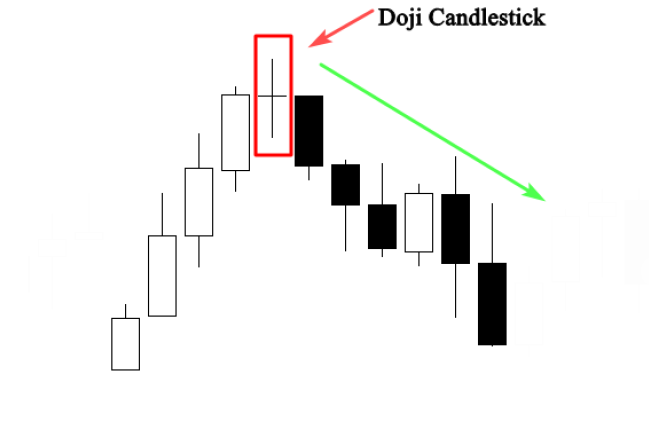
The chart above shows how the market changed direction after a DOJI formed.
The market was trending up, meaning buyers were in control.
The formation of the Doji also indicates that buyers could not sustain higher prices and sellers pushed the price back to the opening level.
This is a clear indication that a reversal may be imminent.
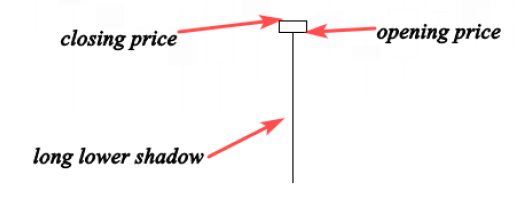
The Dragonfly Doji Pattern
The Dragonfly Doji is a bullish pattern that forms when the open, high, and close are at the same price.
The defining characteristic of this pattern is the long lower tail, which shows buyer resistance as they attempt to push the market higher.
The image above shows a perfect Dragonfly Doji.
The long lower tail indicates that supply and demand are approaching equilibrium, and the trend direction may be nearing a major turning point.
The image below shows a bullish reversal signal formed by a Dragonfly Doji.
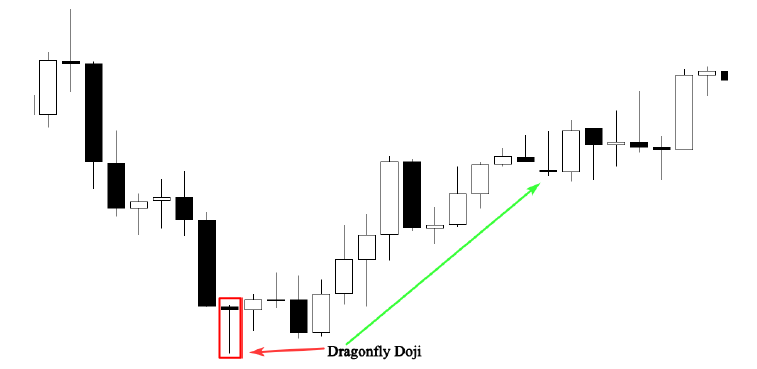
We can see the market testing a support level, causing a strong rejection at that area.
The Dragonfly Doji formation with a long lower tail shows high buying pressure in that zone.
When this pattern occurs in a downtrend, it is a bullish reversal signal.
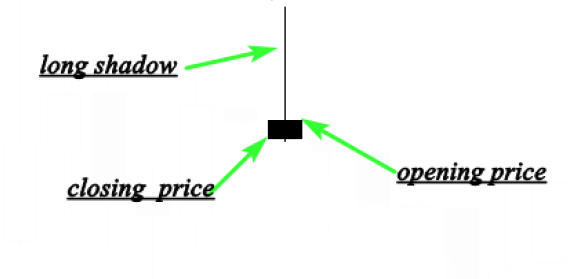
The Gravestone Doji
The Gravestone Doji is the bearish version of the Dragonfly Doji. It forms when the OPEN and CLOSE prices are the same or nearly the same.
The difference between the Gravestone Doji and Dragonfly Doji lies in the position of the long tail — whether it is at the top or bottom.
The formation of a long upper tail indicates the market is testing the supply or resistance area.
The image above shows a perfect Gravestone Doji. This pattern indicates that buyers pushed the price well above the opening price.
However, sellers typically dominate the next session and push the price back down.
This is interpreted as a sign that buyers have lost momentum and the market is ready for a reversal into a downtrend.
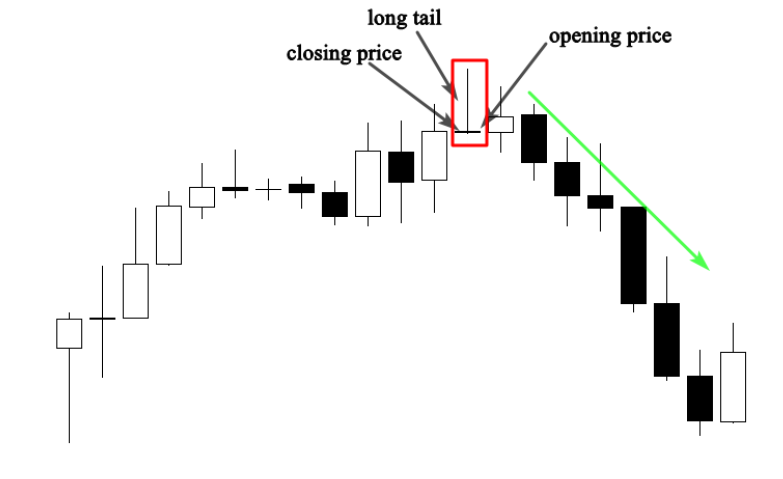
The chart above shows a Gravestone Doji at the top of an uptrend, following a period of strong bullish activity.
The formation of this pattern indicates that buyers are no longer in control of the market.
For this pattern to be more significant, it should occur near a resistance level.
The Morning Star
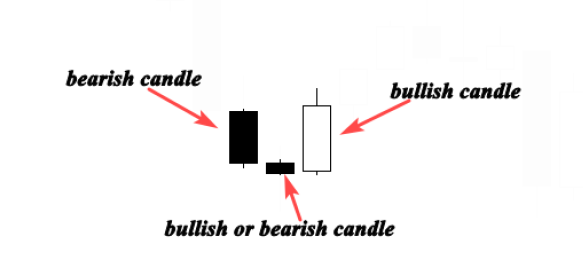
The Morning Star is considered a bullish reversal pattern. It typically occurs at the bottom of a downtrend and consists of 3 candlesticks:
- The first candle is bearish, showing that sellers are still present in the market.
- The second candle is small, indicating sellers are still in play but unable to push the market further down.
- The third candle is a bullish candlestick that gaps up at the open and closes above the midpoint of the first candle, signalling a trend reversal.
The Morning Star pattern shows how buyers take over the market from sellers. When this pattern occurs at the bottom of a downtrend, it is a strong trend reversal signal.
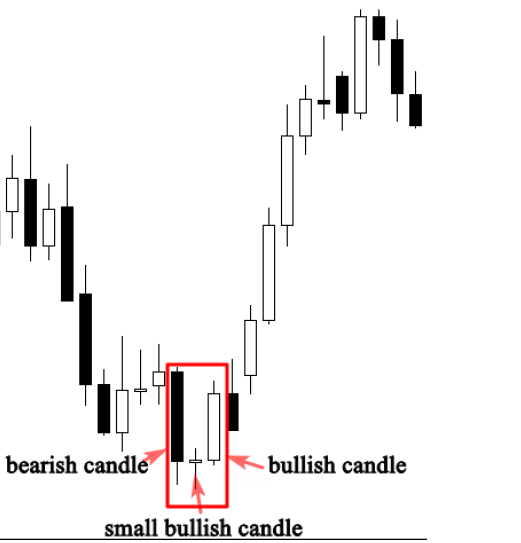
From the chart above, we can identify the Morning Star pattern and understand why it is crucial when it forms at the bottom during a downtrend.
This pattern appeared at the end of a clear bearish trend.
The first candle confirms sellers were controlling the market. The second candle signals indecision and takes the form of a Doji.
Looking at the second candle, the Doji shows sellers tried to push prices lower. However, the third candle reveals buyers taking control from sellers, causing the market to reverse.
The Evening Star Pattern
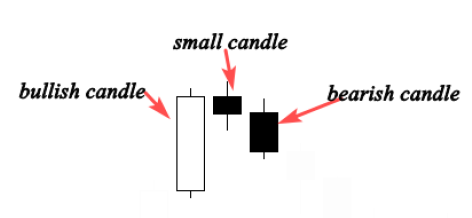
The Evening Star is a bearish reversal pattern that typically occurs at the top of an uptrend. It consists of 3 candlestick formations:
- The first candle is a bullish candle (bulls are still pushing the market higher).
- The second candle is small — it could be bullish, bearish, a Doji, or another pattern. It is indecisive (buyers are still in control but not as powerful as before).
- The third candle is a large bearish candle. The Evening Star is essentially the bearish version of the Morning Star (the buyer's domination is over, and a bearish trend reversal is likely).
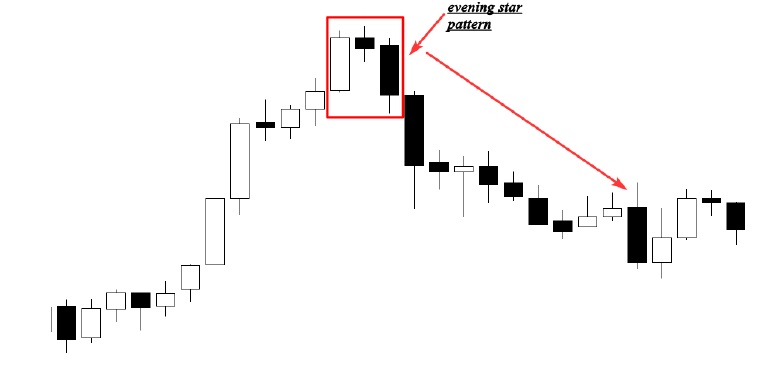
In the chart below, the market was trending up. The first candle shows a long upward move. The second candle is short, indicating price consolidation and indecision. From this, we can tell that the bullish momentum from the first candle has weakened. The final candle confirms the reversal and marks the beginning of a new downtrend.
The Hammer (Pin Bar)
This pattern forms when the open, high, and close are nearly at the same price. Its other characteristic is a long lower shadow, which shows bullish rejection from buyers who want to push the market higher.
The Hammer is a reversal candlestick that appears at the end of a downtrend. This candle forms when sellers push the market to a low after the open, but buyers reject the lower prices and push the market to close higher.
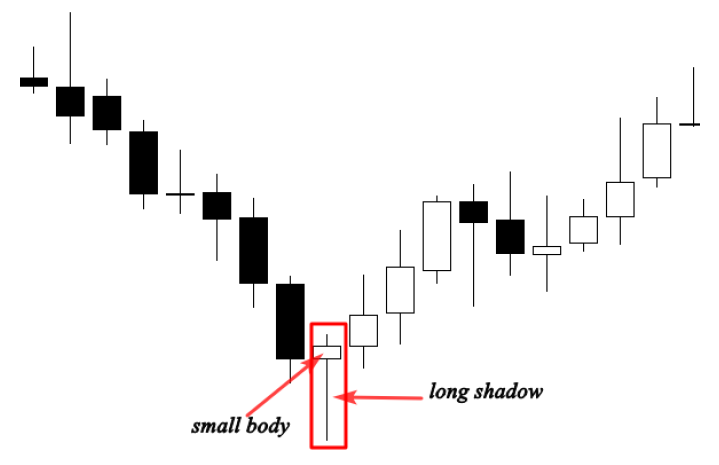
In the chart above, we can see that the Hammer (pin bar) formation is a reversal pattern. Within the red circle, the long shadow represents high buying pressure. Sellers tried to push the market lower but buying power was stronger than selling pressure, resulting in a trend reversal.
The Shooting Star (Bearish Pin Bar)
The Shooting Star occurs when the open is low and the close is nearly the same as the open. This candle has a small body with a long upper shadow. It is the bearish version of the Hammer. When this pattern appears during an uptrend, it signals a bearish reversal.
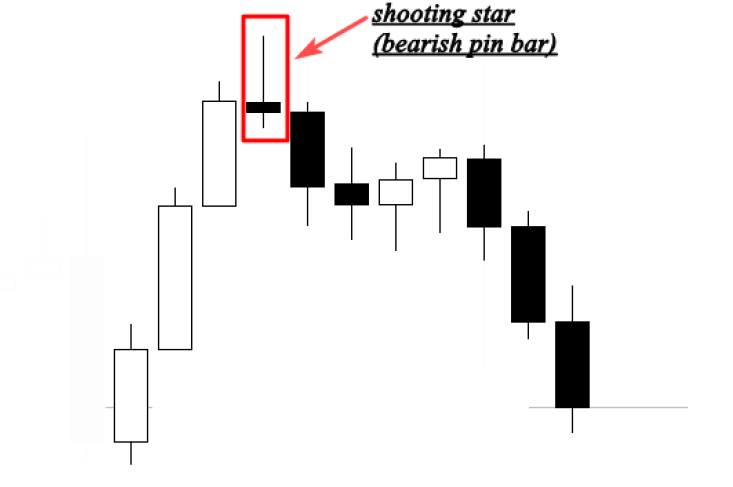
The chart above shows a Shooting Star at the end of an uptrend. This pattern marks the end of the uptrend and the beginning of a downtrend. It can be used together with support & resistance, supply & demand, and other technical indicators. This candle is very easy to identify and provides a powerful signal for market entry.
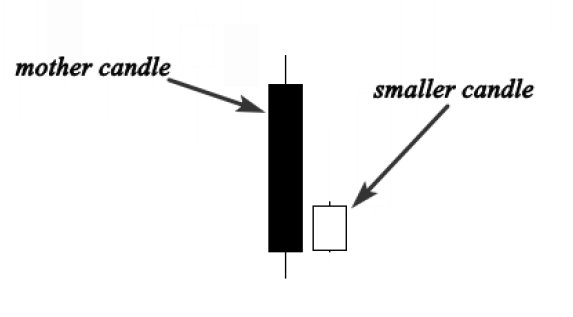
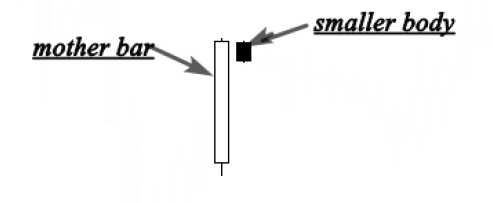
The Harami Pattern (The Inside Bar)
The Harami is both a reversal and continuation pattern. It consists of 2 candlesticks. The first candle is a large candle called the mother candle, and the second is a smaller candle called the baby candle. For this pattern to be valid, the second candle must close within the range of the first. The pattern is considered a bearish reversal when it appears at the end of an uptrend, and a bullish signal when it appears at the end of a downtrend.
The Harami candle tells us the market is in an indecision period — in other words, a consolidating or sideways market.
Neither buyers nor sellers know what to do, and no one is in control of the market.
When this candle appears during an uptrend or downtrend, it can be interpreted as a continuation pattern, giving us the opportunity to join the trend.
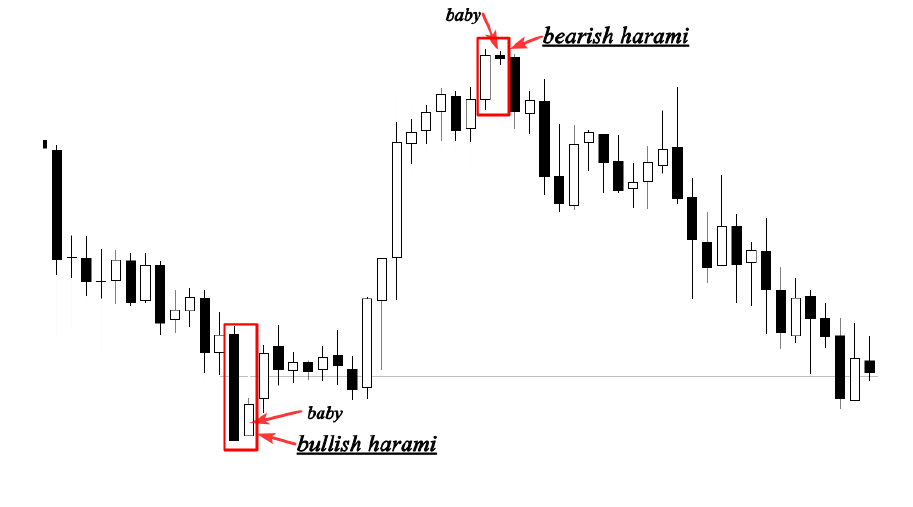
In the chart above, we can see the trend change when the Harami pattern forms. First, a bullish Harami at the bottom of a downtrend shows sellers pushed the market lower but then the price began consolidating — sellers lost power. Second, a bearish Harami at the top of an uptrend shows buyer domination has ended and a downtrend is about to begin. It serves as a continuation signal when the pattern forms during an uptrend or downtrend.
The Tweezers Tops and Bottoms
The Tweezer Top formation is considered a bearish reversal pattern because it occurs at the top of an uptrend. Meanwhile, the Tweezer Bottom is considered a bullish reversal pattern because it occurs at the bottom of a downtrend.
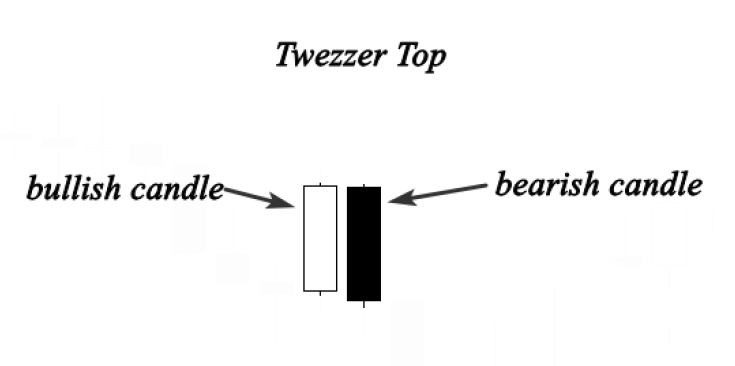
The Tweezer Top formation consists of 2 candlesticks: a bullish candlestick followed by a bearish one.
The Tweezer Top forms during an uptrend when buyers push prices higher, giving the impression the market is rising.
However, sellers then surprise buyers by pushing the market price back below the opening level.
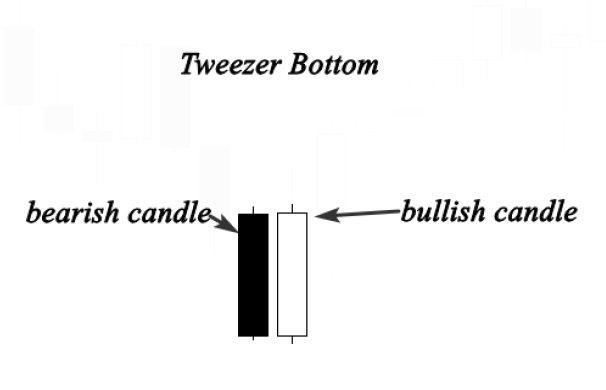
The Tweezer Bottom formation is a bearish candlestick followed by a bullish one.
It occurs at the bottom of a downtrend when sellers push the market lower, giving the impression the market is falling.
However, in the next session, the price closes at or above the first bearish candle, meaning buyers are trying to take control and reverse the market.
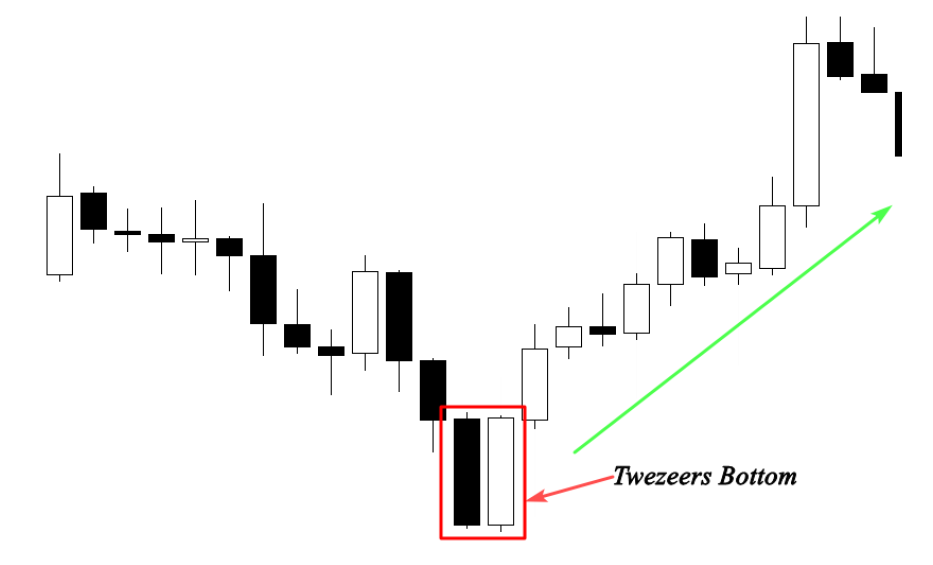
The chart above shows a Tweezer Bottom in a downtrend. We can see the first session pushed prices lower. However, in the second session, the price opened near the close of the first session and showed a reversal signal.
Conclusion
That is all for now. We hope this guide has been helpful for you.
Our final advice: you do not need to memorise every pattern name. We understand that for beginners, it can be difficult to remember all the names.
Start by focusing on the position of these candlesticks and why they form.
Once you understand that, you will know what is happening in the market.
FAQ - Candlestick Patterns
What is the most reliable candlestick pattern for beginners?
The Engulfing Bar pattern (both bullish and bearish) is one of the most reliable and easiest to identify for beginners. It provides clear visual signals of potential trend reversals and is widely used by Malaysian traders on Bursa Malaysia.
Can candlestick patterns be used for Bursa Malaysia stocks?
Yes, candlestick patterns are universal and work across all markets, including Bursa Malaysia. They are particularly useful when combined with support and resistance levels and other technical indicators relevant to the Malaysian stock market.
How many candlestick patterns should I learn as a beginner?
Start with 3 to 5 key patterns such as the Engulfing Bar, Doji, Hammer, Shooting Star, and Morning Star. Master these before moving on to more complex patterns. Quality of understanding matters more than quantity.
Do candlestick patterns work on their own?
Candlestick patterns are most effective when combined with other forms of technical analysis such as support and resistance, volume analysis, and trend indicators. Using them in isolation may lead to false signals.
What time frame is best for candlestick analysis?
For stock trading on Bursa Malaysia, daily and weekly charts tend to produce the most reliable candlestick signals. Shorter time frames like 15-minute or hourly charts can also be useful for day traders but may produce more noise.
Level Up Your Investment Knowledge
Successful investing starts with solid knowledge.
Investment Basics:
Download our free Stock Market Basics Ebook for a complete guide.
Open a CDS Account:
Ready to get started? Open a CDS Trading Account today.