5 Reversal Chart Patterns Every Trader Should Know
There are 5 types of reversal chart patterns commonly used by traders. These include the Head and Shoulders, Double Tops and Bottoms, Triple Top & Bottom, Spike V Top & Bottom, and Rounding Pattern.
Types of Reversal Chart Patterns (RCP)
In the stock market, both technical and fundamental analysis are crucial for studying the price movements of a particular stock.
This article will share a few technical analysis concepts, specifically chart patterns that indicate price reversals (Reversal Patterns). Once you can identify these chart patterns, you will immediately understand what they signify.
First RCP: Head & Shoulders
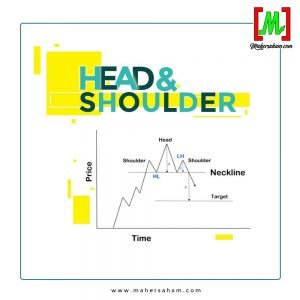
The Head and Shoulders is a formation with 3 peaks, where the left and right peaks are approximately the same height, and the middle peak is the highest.
It indicates a price movement from an uptrend to a downtrend.
Many investors believe this pattern is one of the most powerful and reliable trend reversal signals.
Second RCP: Double Top & Bottom
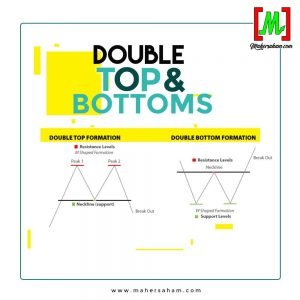
Double Tops and Bottoms are important technical analysis patterns used by investors.
A Double Top has an 'M' shape and indicates a bearish price movement.
Meanwhile, a Double Bottom has a 'W' shape with a bullish price movement.
Third Reversal Chart Pattern: Triple Top & Bottom

For a Triple Bottom, the price drops to the support level and attempts to break through support 3 times. This creates a strong support level, hence the name Triple Bottom.
However, a Triple Top is the opposite of a Triple Bottom, where the price attempts to break through resistance 3 times before falling back, forming a Triple Top.
Fourth RCP: Spike V Top & Bottom

The Spike V pattern shows a sharp formation either at the top or the bottom. It forms without giving any prior signals.
This type of situation is difficult to trade, and the best approach is to exit the market during such conditions.
Fifth Reversal Chart Pattern: Rounding Pattern
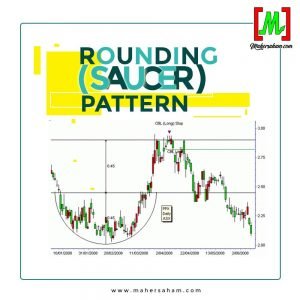
The Rounding Saucer is also a type of reversal chart pattern. However, it takes a longer time to form and the price moves gradually.
This chart pattern is typically observed on weekly or monthly timeframes spanning several years.
Conclusion
Before buying any stock counter, you need to understand technical analysis so that you know where to enter (buy) and exit (sell).
Frequently Asked Questions (FAQ)
What is a reversal chart pattern?
A reversal chart pattern is a chart formation that signals a change in the direction of a stock's price trend, either from an uptrend to a downtrend or vice versa.
What are the 5 main types of reversal chart patterns?
The five main types are Head and Shoulders, Double Tops and Bottoms, Triple Top and Bottom, Spike V Top and Bottom, and Rounding Pattern.
How do you identify a reversal chart pattern?
You need to observe the price movements on the chart and identify formations such as double peaks or head and shoulders patterns that indicate a potential trend change.
Are reversal chart patterns 100% reliable?
No. No technical analysis is 100% accurate. Reversal patterns should be combined with other indicators and sound risk management practices.
Mastering reversal chart patterns is a crucial step towards becoming a more disciplined trader — and the first step is having a CDS account to start trading.
Open a CDS account with Mahersaham to begin investing in stocks on Bursa Malaysia.
Download the free Stock Basics Ebook to learn the fundamentals of stock investing from scratch.
Further reading: